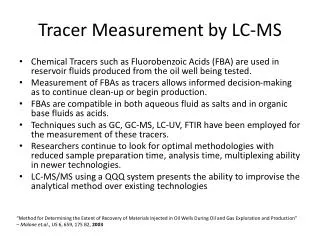
Share the ppb level accuracy in common LC-MS analysis
410 likes | 574 Vues
Share the ppb level accuracy in common LC-MS analysis. Zhang Jiyang School of Mechanical Engineering and Automatization, National University of Defense Technology November 14 , 2012. Outline. Background Proteomics goes to the high-high age Instrument calibration and data re-calibration

Share the ppb level accuracy in common LC-MS analysis
E N D
Presentation Transcript
Share the ppb level accuracy in common LC-MS analysis Zhang Jiyang School of Mechanical Engineering and Automatization, National University of Defense Technology November 14, 2012
Outline • Background • Proteomics goes to the high-high age • Instrument calibration and data re-calibration • FTDR 2.0: implement ppb level re-calibration • Workflow • Algorithms • Results • Discussions • How to utilize the high accuracy?
Background Proteomics: the discovery loop Dreams and stories Technology needs Low-Low Insights on the technologies and biological stories Advances on instrument and experiment protocol Proteomics High-Low Data analysis algorithms and tools High-High
High sensitivity LTQ MSand MS/MS • Low-Low Very fast scan speed MET: 0.6Da MET: 3Da No obvious isotopic profiles Few isotopic profiles only for very high signals
High-Low LTQ/FT Scan speed vs. spectrum quality MS/MS scan MS scan Isotopic profile (not so good) Isotopic profile
LTQ/Orbitrap Ion storage MS and MS/MS scan Store and CID fragment Scan speed vs. spectrum quality Isotopic profile Isotopic profile
Some literatures • Cox J, Mann M. Quantitative, high-resolution proteomics for data-driven systems biology. Annu Rev Biochem. 2011 Jun 7;80:273-99. • Mann M, Kelleher NL. Precision proteomics: the case for high resolution and high mass accuracy. Proc NatlAcadSci U S A. 2008 Nov 25;105(47): 18132-8. • Nilsson T, Mann M, Aebersold R, Yates JR 3rd, Bairoch A, Bergeron JJ. Mass spectrometry in high-throughput proteomics: ready for the big time. Nat Methods. 2010 Sep;7(9):681-5. • Altelaar AF et al. Database independent proteomics analysis of the ostrich and human proteome. Proc NatlAcadSci U S A. 2012 Jan 10;109(2):407-12. Epub 2011 Dec 22. • Lamond AI, Uhlen M, Horning S, et al. Advancing cell biology through proteomics in space and time (PROSPECTS). Mol Cell Proteomics. 2012 Mar;11(3):O112.017731. Epub 2012 Feb 6. More dreams with high accuracy and high resolution instruments: Top-down, cross-link based PPI, PTM identification and discovery, real time state monitor of cells…
What can be benefited from high accuracy? • Database search: less candidates • De Novo: less possible • XIC based quantification: less noise? • PTM: less false positives blank Yu L, Xiong YM, Polfer NC. Periodicity of monoisotopic mass isomers and isobars in proteomics. Anal Chem. 2011 Oct 15;83(20):8019-23. Mitra I, Nefedov AV, Brasier AR, Sadygov RG. Improved mass defect model for theoretical tryptic peptides. Anal Chem. 2012 Mar 20;84(6):3026-32.
Accuracy in control and common experiments Haas W, Faherty BK, Gerber SA, Elias JE, Beausoleil SA, Bakalarski CE, Li X, Villén J, Gygi SP. Optimization and use of peptide mass measurement accuracy in shotgun proteomics. Mol Cell Proteomics. 2006 Jul;5(7):1326-37. <2ppm in well controlled experiments Olsen JV, de Godoy LM, Li G, Macek B, Mortensen P, Pesch R, Makarov A, Lange O, Horning S, Mann M. Parts per million mass accuracy on an Orbitrap mass spectrometer via lock mass injection into a C-trap. Mol Cell Proteomics. 2005;4(12):2010-21.
Instrument calibration Muddiman DC, Oberg AL. Statistical evaluation of internal and external mass calibration laws utilized in fourier transform ion cyclotron resonance mass spectrometry. Anal Chem. 2005 Apr 15;77(8):2406-14. • Internal calibration and external calibration Regress a formula from frequency and charge space effect to m/z.
Instrument calibration • Automatically performed on Orbitrap and FT Parameters can be viewed in raw files
Data re-calibration • Question: why the m/z measurement errors vary with time? • Question: Can we calibrate the m/z values after the data collections? • Which (parameters) are relative to the m/z measurement errors? If possible
Data re-calibration Nat Biotechnol. 2008 Dec;26(12):1367-72. MaxQuant enables high peptide identification rates, individualized p.p.b.-range mass accuracies and proteome-wide protein quantification. Cox J, Mann M. J Am Soc Mass Spectrom. 2009 Aug;20(8):1477-85. Computational principles of determining and improving mass precision and accuracy for proteome measurements in an Orbitrap. Cox J, Mann M. J Proteome Res. 2011 Apr 1;10(4):1794-1805. Epub 2011 Feb 22. Andromeda: A Peptide Search Engine Integrated into the MaxQuant Environment. Cox J, Neuhauser N, Michalski A, Scheltema RA, Olsen JV, Mann M.
Data re-calibration • Our work: J Proteome Res. 2009 Feb;8(2):849-59. Mass measurement errors of Fourier-transform mass spectrometry (FTMS): distribution, recalibration, and application. Zhang J, Ma J, Dou L, Wu S, Qian X, Xie H, Zhu Y, He F. • Simple Calibration • J Proteome Res. 2010 Jan;9(1):393-403. • MSQuant, an open source platform for mass spectrometry-based quantitative proteomics. • Mortensen P, Gouw JW, Olsen JV, Ong SE, Rigbolt KT, Bunkenborg J, Cox J, Foster LJ, Heck AJ, Blagoev B, • Andersen JS, Mann M. • Nonlinear calibration: Mol Cell Proteomics. 2010 Mar;9(3):486-96. Epub 2009 Dec 17. DtaRefinery, a software tool for elimination of systematic errors from parent ion mass measurements in tandem mass spectra data sets. Petyuk VA, Mayampurath AM, Monroe ME, Polpitiya AD, Purvine SO, Anderson GA, Camp DG 2nd, Smith RD. • Application: Search with large MET, filteration with little MET: Comparison of Database Search Strategies for High Precursor Mass Accuracy MS/MS Data Edward J. Hsieh, Michael R. Hoopmann, Brendan MacLean and Michael J. MacCoss J. Proteome, 2010, 9 (2):1138–1143
FTDR: ppb level calibration • Reduce the system error of m/z measurement, share the ppb level accuracy in common LTQ/FT and LTQ-Orbitrap experiments Is it possible?
Workflow: Local to global XIC (or EIC) : extracted ion chromatogram
Key Algorithms in FTDR • Parameters extraction and selection • XIC extraction • Parent ion re-selection • Local calibration models
Parameters for local model • Basic: observed m/z , RT, TIC, parent ion intensity (log transform), relative parent ion intensity. • Status: FT 83, Orbitrap:107,RFvoltage,temperature of ICR. • Operation: Ion Injection time, Scan time et al. • isotopic profile: goodness of fitting, number of isotopic peaks.
How to obtain these parameters? RT m/z, intensity
Parameter selection • Nonlinear relations: mRMR, minimum Redundancy Maximum Relevance Feature Selection Chris Ding, and HanchuanPeng . Minimum redundancy feature selection from microarray gene expression data. Journal of Bioinformatics and Computational Biology, 2005 , 3(2):185-205. Recent works used this kind of method: Reshef DN, et al. Detecting novel associations in large data sets. Science. 2011 Dec 16;334(6062):1518-24.
Parametee selection MI: Mutual information MI Parameter 0.6767 mz experiment 0.5389 Retention time 0.0573 FT IOS +275 Supply (V) 0.3203 IsoNum 0.2836 FT RF1 Amp. Temp. (C) 0.4637 Ambient Temp. (C) 0.0441 Gate Lens (V) 0.3682 FT EA Temp. (C) 0.2030 Nitrogen (%) 0.5298 Source Current (uA) 0.0446 FT EA -32 Supply (V) 0.1401 RF Detector Temp (C) 0.3620 RF Generator Temp (C) 0.0567 Relative PInt 0.0348 Front Section (V) • FT:15 MI Parameter 0.6767 mz experiment 0.5389 Retention time 0.3203 IsoNum 0.2836 FT RF1 Amp. Temp. (C) 0.4637 Ambient Temp. (C) 0.3682 FT EA Temp. (C) 0.2030 Nitrogen (%) 0.5298 Source Current (uA) 0.1401 RF Detector Temp (C) 0.3620 RF Generator Temp (C) Remove the little MI
Parametee selection MI Parameter 0.1792mz experiment 0.0639 Abs PInt 0.0512 -28V Supply Voltage (V) 0.0417 FT IOS -275 Supply (V) 0.0393 FT Deflector Measure Voltage (V) 0.0818IsoNum 0.0362 FT TMPC HS Temp. (°C) 0.0434 FT Main RF Amplitude (Vp-p) 0.0329 FT HV Lens 3 (V) 0.0581 Relative PInt 0.0304 Front Lens (V) 0.0466 FT HV Ion Energy (V) 0.0392 Gate Lens (V) 0.0382 FT Storage Multipole Offset (V) 0.0286IsoMGD • Orbitrap:15 m/z experiment Retention time Elapsed Scan Time Relative PInt IsoMGD +24V Supply Voltage (V) MI>0.05
Isotopic profile match in each MS XIC Extraction • 4 kind of XIC trunked methods were used in FTDR : 1st –RT or count gap, 2nd RT range, 3rd MS signal count, 4thSavitzky–Golay (SG) smoothing and local minimal points detection. • The 1st is used in any XIC searching step in FTDR. The 2nd is only used in the calibration step and will be automatically disabled when the 4th rules was used. The 3rd is used to limited the volume of training datasets by counting the observations. MET: m/z error tolerance
Incorrect position Parent ion re-selection Monoisotopic peak overlap Absent All possible interpretations Multiple possibility
Parent ion re-selection Extract all peaks Segment into different isotopic profile group Fitting to the predict distribution +1 +2 C2 Assign back to the MS/MS spectrum + C1 +2 C3 + Decompose each isotopic profile group Result: one MS/MS spectrum may generate multiple targets
Local models (try and implement) • Linear model: parameter transform • Local linear: multivariate(hard to implement) • Local Linear:piecewise on RT • Nonlinear:SVMregression (using LIBSvm source code) Robustness and Accuracy.
Result & discussion • Local calibration and global calibration on ISB_FT dataset • Global calibration on the Yeast_FT_dataset • Compare with MaxQuant • Try on the label free quantification dataset
Dataset: ISB_FT Mix 3, original MET 5ppm Ref: Klimek J et al. The standard protein mix database: a diverse data set to assist in the production of improved Peptide and protein identification software tools. J Proteome Res. 2008 Jan;7(1):96-103. Performance comparison Note: (1) not XIC global calibration, (2) linear models: mz2, TIC*mz2tansform, SVM dose not use (3) MET is estimated by the residual distribution.
Performance of Global Calibration • Model:SVR • MET:0.46ppm Signal intensity relative MET is more reasonable! a=0.429970 b=0.058963 Breitwieser FP, et al. General statistical modeling of data from protein relative expression isobaric tags. J Proteome Res. 2011 Jun 3;10(6):2758-66.
Liu K, Zhang J, Wang J, Zhao L, Peng X, Jia W, Ying W, Zhu Y, Xie H, He F, Qian X. Relationship between Sample Loading Amount and Peptides Identification and Its Effect on Quantitative Proteomics. Anal Chem. 2009;81(4):1307-14. Database search results • Dataset: Yeast_FT_RP10 • Search: Mascot V 2.1 Conclusion: The m/z error filtration can affect the database search and result validation model. +/-1.3ppm, 15ppm, Different for different mgf # 91430: with parent ion re-selection, @ max range given by Intensity model *Validate method: 2d cutoff model, FDR=1%, ref to: Ma J, et al. Proteomics. 2010;10(23):4293-300.
FTDR performance on 6 datasets D1&D2: Klimek J et al. The Standard Protein Mix Database: A Diverse Data Set To Assist in the Production of Improved Peptide and Protein Identification Software Tools. J. Proteome Res. 2008, 7 (1): 96-103. D3: Chen M et al. Analysis of human liver proteome using replicate shotgun strategy. Proteomics, 2007. 7(14): 2479-88. D4: Cox, J.; Mann, M., MaxQuant enables high peptide identification rates, individualized ppb-range mass accuracies and proteome-wide protein quantification. Nature Biotechnology 2008, 26 (12):1367-1372. D5: Jedrychowski M et al. Evaluation of HCD- and CID-type fragmentation within their respective detection platforms for murine phosphoproteomics. Mol Cell Proteomics 2011, 10 (12):M111 009910. D6: Liu K et al. Relationship between Sample Loading Amount and Peptide Identification and Its Effects on Quantitative Proteomics. Anal. Chem. 2009, 81: 1307-1314. Database search: Mascot 2.3
Different search engines Parameters: 2ppm, 0.6Da Dataset: ISB_control_FT Mix 3 B: Before re-calibration A: After re-calibration
Liu K, Zhang J, Wang J, Zhao L, Peng X, Jia W, Ying W, Zhu Y, Xie H, He F, Qian X. Relationship between Sample Loading Amount and Peptides Identification and Its Effect on Quantitative Proteomics. Anal Chem. 2009;81(4):1307-14. In common experiments • Dataset: Yeast total, 10 repeat LC-Runs *The ppb level record is conservatively predicted by the signal intensity model.
Compare with MaxQuant • Label free search on Yeast_FT_dataset *Dose not provide the m/z errors for the records after calibration.
For label free dataset Liu K, Zhang J, Wang J, Zhao L, Peng X, Jia W, Ying W, Zhu Y, Xie H, He F, Qian X. Relationship between Sample Loading Amount and Peptides Identification and Its Effect on Quantitative Proteomics. Anal Chem. 2009;81(4):1307-14. • Dataset: Yeast total, 10 repeat LC-Runs • Database search : X!Tandem • Quantification: MassChroQ B. Valot, O. Langella, E. Nano, and M. Zivy, “Masschroq: A versatile tool for mass spectrometry quantification,” Proteomics, vol. 11, no. 17, pp. 3572–3577, 2011. No obvious improvement on the CV
XIC is robust to MET? • Smoothing and other filtration can reduce the noise signal? • The high resolution instrument provide the “clean” signals? No preponderant signals in a large range
Discussion • Implement specific MET search for each spectrum? Like Andromeda. • Only can be tried on open source database search engine: X!Tandem, Inspect and Crux. • Initial result: no obvious difference on speed and results for X!Tandem. • Possible reasons: X!Tandem is so fast, and provide less results than Sequest or Mascot. Modified mgf header Modified source code
Software design • GUI • Multiple Threads • Output: mzXML, mzML, or mgf • Quick result view • Workspace save and load • Advance parameters
Other applications under considering • PTM search • LC-MSE data processing • Label free quantification with UPLC(narrow XIC)?
Acknowledgement • ISB: control dataset • Dr. Jie Ma, BPRC • Prof. Yunping Zhu, BPRC • Prof. Xiaohong Qian, BPRC • Our team: Prof.Hong wei Xie, Wei Zhang, ChangmingXu.