Download
1 / 25
250 likes | 344 Vues
Learn how to create informative tables, graphs, and illustrations to present data clearly and engage readers. Discover essential tips, examples, and best practices for designing impactful visual aids in your documents and reports.

E N D
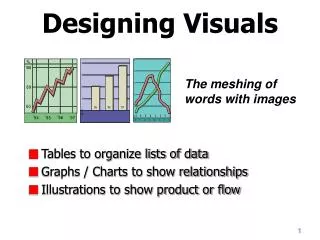
Designing Visuals The meshing of words with images Tables to organize lists of data Graphs / Charts to show relationships Illustrations to show product or flow
Table 1. Blood glucose levels [Carlson, 1982]. Normal (mg/dl*) 100.3 93.6 88.2 100.5 138.6 102.4 93.8 132.3 103.8 93.6 127.8 109.2 Diabetic (mg/dl) 175.8 165.7 159.4 72.1 271.0 224.6 161.8 242.7 219.4 152.6 227.1 221.3 Time (hour) midnight 2:00 4:00 6:00 8:00 10:00 noon 2:00 4:00 6:00 8:00 10:00 * decaliters/milligram Tables • Present detailed facts in a concise, readable form • Avoid needless repetition of words • Help reader find specific facts quickly • Discuss table in text
To create effective tables: • Number them in order of presentation (Table 1, Table 2, etc.). • Title all tables (Table 1: Comparison of Annual Wages). • Place tables soon after mentioned in text. • Do not insert table before mentioned in text. • Use introductory lead-ins to tables. • Provide follow-up explanations to tables, explaining the significance. • Provide headings for all columns.
To create effective tables: • Abbreviate terms to size columns appropriately. • Do not crowd tables on a page. • Separate columns with ample white space for easy readability. • Show omissions with ellipses ( . . .) or hyphens/ dashes ( - - - ) • Use numbers consistently (either ½ or .5) • Write “cont.” if a table spans more than one page.
Graphs and Charts • Convert numbers and words into shapes that are easy to interpret and compare • Types include • Bar graphs • Line graphs • Pie charts
Breakfast 300 250 200 150 100 50 0 Dinner Lunch Diabetic Blood Glucose Level (mg/dl) Normal 12:00 6:00 am 12:00 6:00 pm 12:00 Hour Figure 11. Blood glucose levels for normal individual and diabetic [Carlson, 1982]. Line Graphs: Demonstrate changes in quantitative data over time • Use a grid • Time along the bottom • Place dots along the grid to show time segments • Connect the dots
Table 2. Blood glucose levels [Carlson, 1982]. Breakfast 300 250 200 150 100 50 0 Dinner Lunch Diabetic Blood Glucose Level (mg/dl) Normal (mg/dl*) 100.3 93.6 88.2 100.5 138.6 102.4 93.8 132.3 103.8 93.6 127.8 109.2 Diabetic (mg/dl) 175.8 165.7 159.4 72.1 271.0 224.6 161.8 242.7 219.4 152.6 227.1 221.3 Time (hour) midnight 2:00 4:00 6:00 8:00 10:00 noon 2:00 4:00 6:00 8:00 10:00 Normal 12:00 6:00 am 12:00 6:00 pm 12:00 Hour * decaliters/milligram Figure 11. Blood glucose levels for normal individual and diabetic [Carlson, 1982]. Tables vs Graphs
Bar Graphs: Compare Items • Compare related items • Illustrate changes in data over time • Show segments as parts of wholes • May be vertical, horizontal, grouped, or segmented bars • Avoid showing too much information (produces clutter and confusion) • Length of bars should be proportional • Dollars or percents should start at zero. Figure 1. Comparison of 2005 Rainfall to Average
Disagree Strongly 28% Disagree 38% Agree 13% No Opinion 3% Strongly Agree 18% Pie Chart: Visualize a whole unit and the proportion of its components • Use four to eight segments for best results • Group small portions into one wedge called “Other.” • Distinguish wedges with color, shading, or crosshatching. • Keep all labels horizontal.
Flow charts • Display a process or procedure • Use standard symbols
To create effective figures: • Number the figures in order of presentation (Figure 1, Figure 2, etc.). • Title each figure (Figure 1: Percentages of Work Performed). • Preface each figure with an introductory lead-in. • Do not use a figure until mentioned in the text. • Present the figure as soon as mentioned. • Explain the figure’s importance. • Label the figure’s components (x- and y-axes, for example). • Provide a legend when necessary. • Define any abbreviations. • Cite sources of information as needed. • Do not crowd figures on a page. • Size the figures appropriately for readability.
Graphic Illustrations • Photograph, drawing, or diagram to enhance comprehension • Introduce and explain the illustration in the text • Make sure your text is consistent with your illustration
Photographs provide realism 60 seconds 59.5 seconds 59 seconds Figure 2. Space Shuttle Challenger, from about 59 seconds to 60 seconds into launch (January 28, 1986). On the right rocket, flame first becomes visible and then impinges on tank.
Drawings provide control over detail Used to describe a mechanism
Diagrams provide ability to show flow of variable through a system or a process Figure 8. Schematic of test stand for evaluating components of an air conditioner design.
When you design an illustration…. • Determine the events and objects in the process • Determine the relationship between each event or object • Create a means to represent the events and relationships (geometric shapes, sketches, arrows, etc.) • Draw the diagram • Write text that introduces the process and explains the stages of the process. Make sure the text matches the diagram.
DSPH RECEIVER TSU TSH FLASH TANK FT T S S G TURBINE DEAR- ATOR HOT WELL HP HTR Figure 5. Schematic of thermalstorage system. Avoid illustrations that are too complex for the text The thermal storage system stores heat in a huge, steel- walled tank. Steam from the solar receiver passes through heat exchangers to heat the thermal oil, which is pumped into the tank. The tank then provides energy to run a steam generator to produce electricity. A schematic of this system is shown in Figure 5.
650°F 580°F 530°F 575°F solar receiver Heat Exchanger Thermal Tank Heat Exchanger steam generator 425°F 435°F 425°F 250°F The precision of the illustrations should reflect the precision of the text The thermal storage system, shown in Figure 6, stores heat in a huge, steel-walled tank. Steam from the solar receiver heats a thermal oil, which is pumped into the tank. The tank then provides energy to run a steam generator to produce electricity. Figure 6. Schematic of thermal storage system for the solar power plant.
CONTROL TERMINAL PRINTER CAMERA COMPUTER DIGITIZER ELECTRO- MECHANICAL INTERFACE ROCKET Figure 8. Testing hardware. Inconsistencies between text and images disrupt flow The testing hardware of the rocket shown in Figure 8 has five main components: camera, digitizer, computer, I/O interface, and mechanical interface. Commands are generated by the computer, then passed through the I/O interface to the mechanized interface where the keyboard of the ICU is operated. The display of the ICU is read with a television camera and then digitized. This information is then manipulated by the computer to direct the next command.
Electro- Mechanical Interface 2 1 Computer Rocket 3 4 Camera Digitizer Make sure your text is consistent with the diagram Our system for testing the launch controls of the rocket consists of four main parts: computer, electro-mechanical interface, camera, and digitizer. In this system (shown in Figure 9), the computer generates test commands to the rocket through the electro-mechanical interface. The test results are read with a television camera, and then digitized. The computer receives the information from the digitizer, and then directs the next test command. Figure 9. System to test launch controls for rocket.
Student Sample -- Photograph Micro-electro mechanical systems (MEMS)
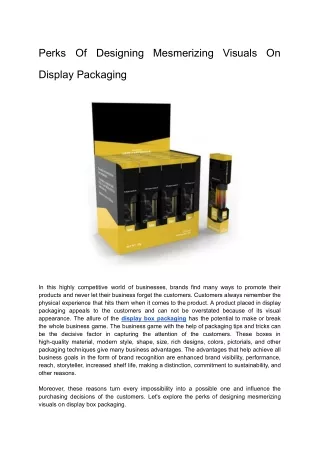
When you push a button, the car cover is rolled in or out of the canister. Illustration – Show an Item in Use The Car Umbrella is a light-weight, new-age protective cover for any car, truck or SUV. The fitted, foldable protective cover rolls up with a push of a button into a galvanized steel canister. The Car Umbrella, which attaches to the rear bumper, can be easily released and wound in and out of the canister via remote control. (See Figure 3) Figure 3. The Car Cover outside of the canister.