Download
1 / 20
200 likes | 296 Vues
Learn how the Illinois State Toll Highway Authority utilizes IPASS technology to improve traveler information, travel times, and safety on toll highways, enhancing mobility and efficiency for commuters and ensuring timely incident response.

E N D
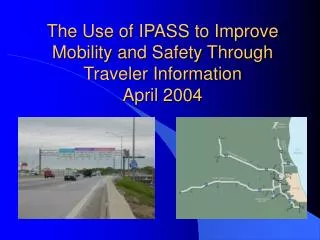
The Use of IPASS to Improve Mobility and Safety Through Traveler InformationApril 2004
Background • The Illinois State Toll Highway Authority (ISTHA) has 274 Miles of Toll Highways • 24 Mainline and 43 Entrance / Exit Ramp Plazas • IPASS Automatic Toll Collection • Over 2 million transactions per day 50% of which are IPASS
Incident Management Fully Integrated 2 Way CAD CCTV DMS Incident Response Plans Travel Times Safety Messages Weather Data Queue Detection Center to Center Interface Open Architecture UNIX Servers / PC Workstations IPASS Travel Times Traffic & Incident Management System (TIMS)2004 Best of ITS Public Safety Award Winner
Point Travel Time Algorithms Detector Station (s) Provides Speed Data Extrapolation TT = L/S Interpolation TT = 2L/(S1+S2)
IPASS Travel Time Data • When a vehicle arrives at a Plaza the following origin and destination data are transmitted to the TIMS • Date • Time • Plaza ID • Lane
AF AE BE IPASS Basic TT Algorithm AB BF 182
Lessons Learned EF Revised Link Equations When two TDLS are used Vi = num Tag Reads TDLi Si = Speed TDLi Avg Speed = V1S1+V2S2/(V1+V2) TT = SegLen/(Avg Speed)
Lessons Learned Standard Deviation Method All Data Near Minimum Method
Algorithm Validation • Floating Car Runs Throughout the System during Peak and Off Peak Periods • Overall - Expected Results were Closely Correlated to Actual
Validation Results • The calculated travel times for long sections of roadway are less accurate during times of unstable flow. • The availability of data for the segment travel times vary significantly. • The impact that variable delays at exit ramp plazas have on computations can be significant. • The sample size for computations and the number of actual tag reads affect the overall quality of the data.
PROS Uses Existing Infrastructure Actual data is very accurate Over one million daily tag reads CONS Existing Infrastructure Optimized for Toll Collections not Traffic Data Where plazas are widely separated (up to 30 miles) TT can lag significantly Only 25% pass the tests for validity Conclusions
Future Efforts • Addition IPASS Readers are planned at the endpoints in conjunction with IDOT • 34 new DMS are being added • Additional IPASS Readers are being planed at more frequent intervals to further improve data resolution • AVL for maintenance, police, and money trucks may be added • Currently through a Federally Funded Program RTMS data is being added in the urban areas to improve data resolution and to add a new incident detection algorithm