Download
1 / 17
170 likes | 279 Vues
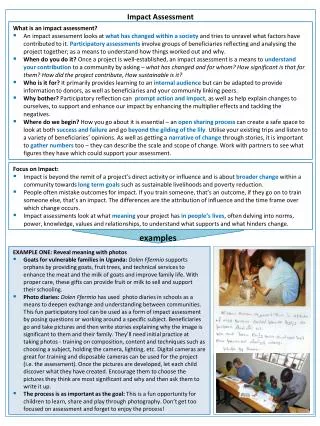
Market and Price Impact Assessment. OBJECTIVES. To quantify the magnitude of the recent increase in food prices To assess the future outlook in different parts of the country To understand the likely impact on household food security

E N D
OBJECTIVES • To quantify the magnitude of the recent increase in food prices • To assess the future outlook in different parts of the country • To understand the likely impact on household food security • To make recommendations for government and humanitarian relief
BACKGROUND • Food prices in Nepal have not increased to the same extent as on international markets • Very good recent paddy harvest • Good wheat harvest overall (except in the Far and Mid-Western hills and mountains)
BACKGROUND • Fuel shortages • Transportation companies only able to use 20-30% of their capacity • Proposed fuel price increase of up to 25% • Inflation scaled up to 8.9% for the first three-quarters of the fiscal year 2007/2008 (Nepal Rastra Bank) • Rising food prices are the major factor that increased the CPI • Rise of 12.6% in food and beverages prices (53% of the CPI)
METHODOLOGY • Primary data • FSMAS field monitors and NDRI enumerators • Market survey (5 traders per market) • 357 retailers • 153 wholesalers • Household survey (5 households per market) • 551 households • Rapid urban survey (per urban area: 10 slum households, 2 better off households, 5 traders) • 216 households • 90 urban traders • Secondary data • Department of Agriculture, FNCCI, Nepal Rastra Bank and Ministry of Finance
METHODOLOGY • Geographical coverage • 40 districts • 6 urban cities (Biratnagar, Birgunj, Nepalgunj, Dhangadhi, Kathmandu and Pokhara) • 6 month recall • Prior to October 2007, food price increases were marginal • Pre-harvest period for paddy (highest prices of key commodities) • India introduced the export ban
PRICE CHANGES • Highest increases in nominal prices • cooking oil (30%) • coarse rice (23%) • kerosene (17%) • Less dramatic • wheat grain and flour • Price of coarse rice • highest percent change in the terai and and the hills • highest absolute change in mountains • Farm gate prices of paddy and wheat • highest increase for paddy in the mountains (24%) • highest increase for wheat in the hills (drought-affected) (13%)
Cost of transportation increased by 27% on average and further increases are imminent FACTORS DETERMINING THE PRICE OF COMMODITIES • Transport -related (for hills and mountains) • Imports from India (for the terai)
TRADERS’ PRICE EXPECTATIONS • 11% increase for coarse rice • 17% for traders in the Terai and hills • 8% increase for kerosene • Stabilization for cooking oil (at a much higher price) • Wheat prices • Decrease in the terai • Increase in the hills and mountains (esp. Mid and Far West)
TRADE STOCKS AND SALES • Supply and sales volumes have dropped for more than 60% of traders • 40% less kerosene • 30% less coarse rice • 20% less beans, cooking oil and fine rice • Consistent with the price increase Problems affecting business • 77% reported a decrease in the volume of sales
TRADERS’ RESPONSES In case we need a box
Most households depend on the market for coarse rice, cooking oil and kerosene 59% of HH expenses spent on food (73% for the poorest) IMPACT ON HOUSEHOLDS VULNERABILITY WAGES • Increased by 5-15% • Highest percent in the Terai • Highest absolute value in the mountains IMPACT PURCHASING POWER • Main hazards: food (unavailability/prices), drought, insufficient rain • Food prices affected 57% of HH • People are buying less/cheaper food • Substantial increase of sales on credit • May result in higher malnutrition rates • The purchasing power of households decreased because of the rise in commodity prices
FOOD PRICE VULNERABILITY INDEX • Land access index • Food expenditure index • Income source index For Rural Nepal: Significant losers 42.2 % 9.7 million Marginal losers 41.2 % 9.5 million Marginal winners 3.3 % 14.3 million Significant winners 0.5 % 2.3 million
13 % 35 %
11 % or 2.5 million people 17 % or 3.9 million people
Recommendations • Develop a joint market watch monitoring system. • Provide targeted food assistance to the identified 2.5 million most vulnerable. • Closely monitor the additional 3.9 million who are at high risk of food insecurity. • Support agricultural initiatives to increase food production (irrigation, seeds, credit etc.) • Expand the role of NFC in remote areas and improve the beneficiary targeting. • Expand and strengthen nutrition-based programmes such as MCHC and SF.