Understanding Consumer Demand and Supply Dynamics in Economics
This article explores the fundamental concepts of consumer demand and supply, highlighting how various factors influence the quantity of a commodity that individuals are willing to buy as prices fluctuate. It examines the inverse relationship between price and quantity demanded, differentiating between changes in demand and changes in quantity demanded. Furthermore, the article discusses aggregate demand, factors affecting demand, such as consumer income and preferences, and the importance of understanding opportunity costs in supply dynamics. Essential concepts are illustrated with relevant economic theories and diagrams.

Understanding Consumer Demand and Supply Dynamics in Economics
E N D
Presentation Transcript
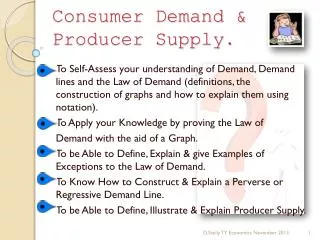
Consumer Demand • Various quantities of a commodity that an individual is willing and able to buy as the price of the commodity varies holding all other factors constant.
Consumer Demand • Demand begins with individual consumer • Inverse relationship between quantity and price • Two dimensional, Price and Quantity
Downward sloping demand • Begin with individual’s utility function and a budget constraint • Substitution effect • consumers buy what’s cheaper • Income effect • “income” increases if prices fall
Market or Aggregate Demand • Add individual demand curves • Horizontally across consumers • http://www.aaec.vt.edu/rilp/Demand%20Changes-2000.pdf (Pages 1-10)
Demand is a function of • Price of substitutes • Price of complements • Consumer income • Taste and preferences • IS NOT FUNCTION OF THE GOOD’S OWN PRICE
Change in Demand orin Quantity Demanded Moving from A to B due to a price decline is a change in quantity demand. Px A A shift of the demand curve from D1 to D2 is a change in demand. B C D2 D1 Qx
Factors effecting aggregate demand for a product • Exports • New product development • Advertising • New information • Product differentiation
Income effect on food demand • Food is normal good • Income demand • Particularly important for meats • Emerging economies • Services are a normal good • Income services
Inverse Demand • Price is a function of quantity • P = f(Q) • Important in agriculture • Short run supplies are relatively fixed • Prices change to clear the market
Supply • The amount of a given commodity that will be offered for sale per unit time as the price varies, other factors held constant.
Supply • Derived from cost function • Production function • Input - output relationship • Assume that firms seek to • Maximize profits • Minimize costs • Supply starts will individual firm
Production Function Output Total Product Decreasing returns to the input Increasing returns to the input Input
Opportunity cost • The opportunity cost of commodity A is income forgone by not producing commodity B. • Measures of opportunity cost • Market value of input • Expected return over other cost of not producing commodity B.
Cost Curves • Average variable cost = AVC • Total variable cost / Q • Variable costs change with Q • Average fixed cost = AFC • Total fixed cost / Q • Fixed costs do not change with Q • Average total cost = ATC = AVC+AFC
Cost Curves • Marginal cost = MC • Change in total cost by producing 1 more • TC / Q
Cost curves Cost MC ATC AVC Q
Supply curve • MC curve above AVC curve • Upward sloping curve • Optimal output @ MC = MR • MR = Price => Optimal at MC=Price • The last unit of input just pays for itself
Profit • Profit = total revenue - total cost • TR= P x Q • TC = ATC x Q • Profit per unit = Profit/Q • = TR/Q - TC/Q • = P - ATC • Profit maximizing Q • MC=MR=P • Profit/Q = P-ATC at optimal Q
Optimal Q at P=MC Cost MC P2 ATC AVC P1 Q1 Q2 Q
Market or Aggregate Supply • Combination of individual supply schedules • Add horizontally across firms • Flattens with time • More time to adjust supply
Market supply curves SLong run SShort run Px Qx
Cost curves and supply • Shut down if P < AVC • Lose on every unit produced • P>AVC make some payment to fixed cost • In the long run everything is variable • Short run defined by having fixed cost • Long run supply curve for individual • Low point on ATC curve
Market supply curves S1 Move from A to B is a change in quantity supplied due to a price decline. Px S2 A B C Move from B to C is a shift in supply. Qx
Supply Shifts from Change • in input prices • in returns for competing enterprises • in technology on yields or costs • in price of joint products • in yield and/or price risk • institutional constraints
Additional references • Reading room Agricultural Product Prices, Tomek & Robinson Chpts 2 and 4.