Download
1 / 66
840 likes | 1.27k Vues
The Influence of Type 2 Diabetes on Cardiovascular Disease and Glycemic Treatment Options Rocky Mountain/ACP Internal Medicine Conference Banff , AB November 22, 2012 David C.W. Lau, MD, PhD, FRCPC Depts. of Medicine , Biochem . & Molec . Biol.

E N D
The Influence of Type 2 Diabetes on Cardiovascular Disease and Glycemic Treatment Options Rocky Mountain/ACP Internal Medicine Conference Banff, AB November 22, 2012 David C.W. Lau, MD, PhD, FRCPC Depts. of Medicine, Biochem. & Molec. Biol. Julia McFarlane Diabetes Research Centre University of Calgary dcwlau@ucalgary.ca
Program Faculty • Dr. Ronald Goldenberg, MD, FRCPC, FACE Consultant Endocrinologist, North York General Hospital and LMC Endocrinology Centers, Thornhill, Ontario • Dr. Mansoor Husain MD, FRCPC Director, Toronto General Hospital Research Institute and Heart and Stroke Richard Lewar Centre for Excellence Senior Scientist, Division of Experimental Therapeutics Professor of Medicine, University of Toronto • Dr. David C. W. Lau MD, PhD, FRCPC Professor of Medicine, Biochemistry and Molecular Biology Julia McFarlane Diabetes Research Centre University of Calgary
Disclosures: David C. W. Lau Researchfunding: • AHFMR, Alberta Cancer Board, CIHR, AstraZeneca, Boehringer-Ingelheim, BMS, Dainippon, Eli Lilly, Novo Nordisk, Pfizer and sanofi Consultant or advisoryboardmember: • Abbott, Allergan, Amgen, AstraZeneca, Bayer, Boehringer-Ingelheim, BMS, Eli Lilly, Merck, Novartis, Novo Nordisk, Pfizer, Roche, sanofi Speaker bureau: • CDA, HSFC, AstraZeneca, Abbott, Bayer, Boehringer-Ingelheim, BMS, Eli Lilly, Merck, Novo Nordisk, sanofi Some slides are selected from accredited CHE programs sponsored by Novo Nordisk and AstraZeneca/BMS
Objectives At the end of the presentation, the participant will be able to: • Understand the cardiovascular burden in diabetes • Review the mechanisms of actions of incretin-based therapies for diabetes • Compare the cardiovascular effects of incretins and other glucose-lowering agents • Review current and ongoing data on incretin-based therapies and cardiovascular disease outcomes
Rising Prevalence of Diabetes Mellitus Frequency of Diagnosed &Undiagnosed DM and IGT by Age Adapted from M Harris. Diabetes Care 1993;16:642-52
Diabetes is a global disease!Estimated global prevalence of diabetes 366 million 552 million 151 million 2000 2011 2030 International Diabetes Federation. IDF Diabetes Atlas. Fifth Edition. 2011
Diabetes Prevalence Rates in Canada, 2008/09 Canada 6.8%, N=2,359,252 Age- and sex-adjusted diabetes prevalence increased by 40% in the next 10 years, from 6.8% in a population to 9.9% or 3.4 million in 2020! Public Health Agency of Canada, Diabetes in Canada. Ottawa, 2011
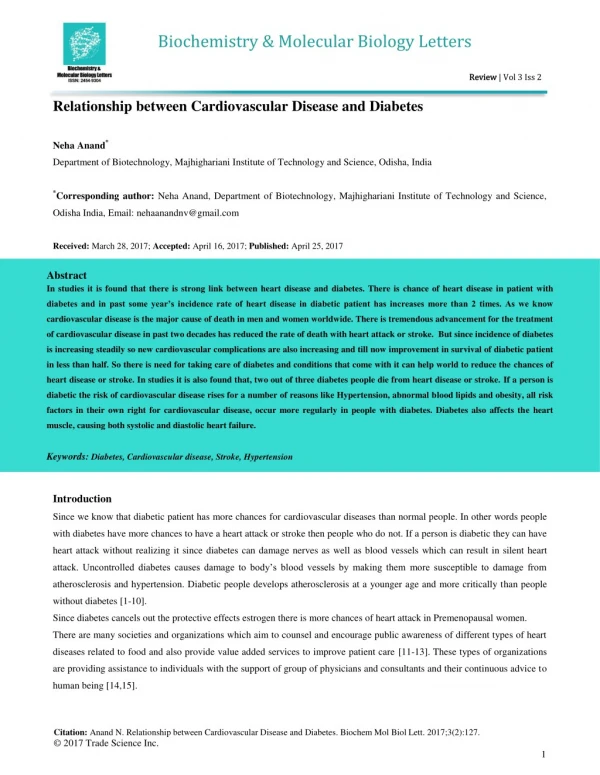
Relative Risks for Fatal CAD in Diabetes Pooled RR = 1.7 from 37 studies; Meta-analysis of 22 studies Huxley R et al., Br Med J 2006;332:73-78
People with DM2 and CVD Derive Less Benefit from Preventive and Interventional Therapies • Patients with diabetes treated with antiplatelet treatments continue to have a higher risk of adverse CV events compared with nondiabetic patients 1 • Reduced antiplatelet drug responsiveness may play a role in these worse outcomes • Diabetes may abolish the beneficial effect of primary percutaneous coronary intervention on long-term risk of reinfarction after acute ST-segment elevation MI 2 CV, cardiovascular; CVD, cardiovascular disease; MI, myocardial infarction AngiolilloDJ. Diabetes Care 2009;32:531-540; Madsen MM, et al. Am J Cardiol2005;96:1469-1475. 9
A1C Predicts Cardiovascular Disease:Reduction Has Important Benefits 21% reduction 21% reduction 14%reduction Diabetes-related endpoints Diabetes-related mortality All-cause mortality 1% A1C reduction 14% reduction 12% reduction 37% reduction Fatal/non-fatal MI Fatal/non-fatal stroke Microvascular endpoints 19% reduction 43% reduction 16% reduction Cataract extraction Amputation/death from PVD Heart failure Stratton IM, et al. BMJ 2000;321:405-412
Glycemic Control and CVD Events Mean A1C 0.9% • 9% major CV events • 15% fatal/ nonfatal MI • No overall effect on stroke, CHF or all-cause mortality Turnbull FM et al. Diabetologia 2009;52:2288-2298
DCCT/EDIC: Glycemic Control Reduces the Risk CV Death, MI, Stroke in Type 1 Diabetes *Intensive vs conventional treatment 9 Conventional treatment A1C (%) Legacy effect: Benefit of early aggressive glycemic control on CVD outcomes 8 Intensive treatment 7 0 Years 1 2 3 4 5 6 7 8 9 11 12 13 14 15 16 17 10 DCCT (intervention period) EDIC (observational follow-up) 0.06 0.04 0.02 0.00 CVD death, MI & Stroke RR 57% (p = 0.02, 95%CI 12-79%) Cumulative incidence of non-fatal MI, stroke or death from CVD Conventionaltreatment Intensivetreatment 0 1 2 3 4 5 67 8 9 10 11 1213 14 15 16 17 18 19 20 21 Years DCCT (intervention period) EDIC (observational follow-up) DCCT. N Engl J Med 1993;329:977–986 DCCT/EDIC. JAMA 2002; 287:2563–2569 DCCT/EDIC. N Engl J Med 2005;353:2643–2653
2008 CDA Clinical Practice Guidelines Recommended Targets for Glycemic Control • Treatment goals and targets must be individualized with considerations given to individual risk factors • Target 2-3 months for lifestyle management before initiating pharmacotherapy A1C ≤ 7.0% FPG (Fasting Plasma Glucose) 4.0 – 7.0 mmol/L 2-hour PPG (Postprandial glucose) 5.0 – 10.0 mmol/L (5.0 – 8.0 if A1C targets are not being met) Type 1 and Type 2 Diabetes Can J Diabetes 2008;32(Suppl 1):S29-S31
Initiate pharmacotherapy immediately without waiting for effect from lifestyle interventions: Consider initiating metformin concurrently with another agent from a different class; or insulin Initiate insulin ± metformin Initiatemetformin If not at target • Add an agent best suited to the individual: • Alpha-glucosidase inhibitor • Incretin agent: DPP-4 inhibitor • Insulin • Insulin secretagogue: Meglitinide, Sulfonylurea • TZD • Weight loss agent • If not at target: • Add another drug from a different class; or • Add bedtime basal insulin to other agent(s); or • Intensify insulin therapy 2008 CDA CPGs. Can J Diabetes 2008;32(Suppl 1):S53–S61
Main Classes ofGlucose-Lowering Medications α-glucosidase inhibitors (delay digestion and absorption of intestinal carbohydrate) DPP-4 inhibitors (prolong GLP-1 action, stimulate insulin secretion, suppress glucagon release) Biguanides(reduce hepatic glucose production and intestinal absorption of glucose; increase peripheral glucose uptake) SUs and rapid-acting secretagogues(stimulate insulin secretion) GLP-1 analogues (increase GLP-1 action, stimulate insulin secretion, suppress glucagon release, decrease appetite, delay gastric emptying) Insulin(improves insulin secretion and peripheral insulin sensitivity) TZDs(reduce insulin resistance in target tissues) TZD = thiazolidinedione; DPP = dipeptidyl peptidase; GLP = glucagon-like peptide Krentz AJ, Bailey CJ. Drugs 2005;65:385-411
DPP-4 Inhibitors Enhance Incretin and Insulin Secretion Food intake DPP-4 inhibitor Increases and prolongs GLP-1 and GIP effects on beta-cells: Beta-cells DPP-4 Insulin release Stomach Net effect: Blood glucose Pancreas GI tract Increases and prolongs GLP-1 effect on alpha-cells: Incretins Glucagon secretion Alpha-cells Intestine Adapted from: Barnett A. Int J ClinPract 2006;60:1454-70 Drucker DJ, Nauck MA. Nature 2006;368:1696-705Idris I, Donnelly R. Diabetes ObesMetab 2007;9:153-65
GLP-1 receptor agonists improve glucose control through multiple mechanisms Ussher J & Drucker DJ, Endocrine Rev 2012;33:187-215
Incretin Therapies Currently Available Injectable Oral GLP-1 analogue: Liraglutidemodified human GLP-1 DPP-4 inhibitors:Linagliptin Saxagliptin Sitagliptin GLP-1 mimetic:Exenatidemodified from Gila monster lizard saliva Saxagliptin Canadian Product Monograph, Bristol Myers Squibb/Astra Zeneca, 2009; Sitagliptin Canadian Product Monograph, Merck Frosst, 2010.; Linagliptin Canadian Product Monograph, BoehringherIngelheim (Canada) Ltd. July 26, 2011.; LiraglutideCanadian Product Monograph, Novo Nordisk Canada, 2011; Exenatide Canadian Product Monograph, Eli Lilly Canada, 2011. DruckerDJ, et al. Lancet 2006;368:1696-705 Slide Courtesy of Novo Nordisk sponsored accredited CHE program
Questions to consider when choosing a glucose-lowering agent • What is the efficacy in A1C reduction? • What is the glycemic durability? • Is the patient at risk for hypoglycemia? • Is weight a concern? • What are the long-term side-effects? • Does the patient have a drug plan? • What is your prescribing comfort level? • What is your patient’s preference?
Glucose Lowering Therapy in Diabetes: A1C Reduction by Baseline A1C ≤7.5% >7.5% - 8.0% >8.0% to 8.5% >8.5% to 9.0% >9.0% 0.5 Diabetes disease progression 0 ** -0.5 ** * ** ** ** Change in A1C from baseline to 26 weeks (%) ** * -1.0 * **** Liraglutide * -1.5 *** Sitagliptin Glimepiride Rosiglitazone -2.0 Exenatide Glargine *p<0.05, **p<0.01, ***p<0.001, ****p<0.0001 vs. liraglutide 1.8 mg; Henry RR, et al. EndocrPract 2011;17(6):907
ADOPT: Kaplan-Meier Estimates of the Cumulative Incidence of Monotherapy Failure at 5 Years Kahn SE et al. N Engl J Med 2006;355:2427-2443
Adverse Outcomes Among Patients with Type 2 Diabetes Experiencing Severe Hypoglycemia The median time from hypoglycemic episode to related adverse event or death was ≤ 1.6 years! 25 Macrovascular event N=11,140 Microvascular event 20 Death from any cause Cardiovascular death 15 Noncardiovascular death No. of adverse outcomes 10 5 0 0–12 13–24 25–36 37–48 Months from severe hypoglycemia to event Zoungas S, et al. N Engl J Med 2010;363(15):1410–18
Emergency Hospitalizations forAdverse Drug Events in Older Americans Estimated Rates of Emergency Hospitalisations for Adverse Drug Events in Older U.S. Adults, 2007–2009 14% Oral agents and insulin account for > 25% of hospitalizations in adults > 65 years! 11% Budnitz DS, et al. N Eng J Med 2011;365:2002-12
Antihyperglycemic Drugs & Risk of Hypoglycemia High • Insulin • Insulin secretagogues • Sulfonyureas • Meglitinides Low • Metformin • DPP-4 inhibitors • GLP-1 receptor agonists • TZDs • Acarbose • Orlistat
Liraglutide Effect and Action in Diabetes (LEAD) Clinical Trials Type 2 diabetes treatment continuum +1 OAD Diet/exercise +3 OAD or +2 OAD, Insulin +2 OAD LEAD 4 Liraglutide+met&TZD vsplacebo+met&TZD LEAD 1 Liraglutide+SU vsTZD+SU LEAD 3 Liraglutide monotherapy vsSU LEAD 5 Liraglutide+Met&SU vsglargine+Met&SU LEAD 2 Liraglutide+Met vsSU+Met Met: metformin SU: sulfonylurea TZD: thiazolidinedione Liraglutide+Met vssitagliptin+Met LEAD 6 Liraglutide+met/SU/both vsexenatide+met/SU/both Garber A et al. Lancet 2009;374:473-81 (LEAD-3); MarreM et al. Diabet Med 2009;26:268–78 (LEAD-1); Nauck M et al. Diabetes Care 2009;32:84–90 (LEAD-2); Zinman B et al. Diabetes Care 2009; 32:1224-30 (LEAD-4); Russell-Jones Detal. Diabetologia2009;52:2046-55 (LEAD-5); Buse J et al. Lancet 2009;374:39-47 (LEAD-6); Pratley R et al. Lancet 2010;375:1447-1456 (Lira vs. sitagliptin)
LEAD Program: A1C Lowering with Liraglutide *significant vs. comparator Garber A et al, Lancet 2009;373:473–81 (LEAD-3); NauckM et al, Diabetes Care 2009;32:84-90 (LEAD 2); Marre M et al. Diabetic Med 2009;26:268-78 (LEAD 1); ZinmanB et al. Diabetes Care 2009;32:1224-30 (LEAD 4); Russell-Jones D et al. Diabetes 2009;52:2046-55 (LEAD 5); BuseJ et al. Lancet 2009;374:39-47 (LEAD 6); Pratley R et al. Lancet 2010;375:1447-1456
Weight Reduction with Liraglutide in People with Type 2 Diabetes LEAD 3 Monotherapy LEAD 2 Met combination LEAD 1 SU combination LEAD 4 Met + TZD LEAD 5 Met + SU combination LEAD 6 Met ± SU combination Met combination(Lira vssita) 2.5 +2.1 2.0 Rosiglitazone +1.6 1.5 Glargine +1.0 +1.1 +0.6 1.0 Glimepiride Glimepiride * 0.5 0.3 Placebo 0.0 Exenatide 43% 51% -0.2 Change in body weight (kg) -0.5 * -1.0 -1.0 -1.0 * -1.5 -1.8 -2.0 Sitagliptin -2.0 * -2.1 * -2.5 * -2.5 -2.6 * -2.9 -2.9 -3.0 -2.8 * * * -3.2 -3.4 -3.5 * *Significant vs. comparator Liraglutide 1.8 mg Liraglutide 1.2 mg Marre M et al. Diabetic Medicine 2009;26;268–78 (LEAD-1); Nauck M et al. Diabetes Care 2009;32;84–90 (LEAD-2); Garber A et al. Lancet 2009;373:473–81 (LEAD-3); Zinman B et al. Diabetes Care 2009;32:1224–30 (LEAD-4); Russell-Jones D et al. Diabetologia 2009;52:2046-2055 (LEAD-5); Buse J et al. Lancet 2009;374 (9683):39–47 (LEAD-6); Pratley R et al. Lancet 2010;375:1447-56 (Lira vs sitagliptin)
Exenatide: 3 AMIGOS TrialsA1C changes After 30 weeks Placebo BID Exenatide 5 µg BID Exenatide 10 µg BID Add-on to MET+SU3 (n=733) Add-on to MET1 (n=336) Add-on to SU2 (n=377) 0.5 Baseline 8.2% Baseline 8.6% Baseline 8.5% 0.2 0.1 0.1 0 Change in A1C (%) -0.5 -0.4 -0.5 -0.5 * * * -1 -0.8 -0.8 -0.9 * * * ITT population; Mean (SE); *p < 0.05 vs. placebo 2. Buse et al. Diabetes Care 2004 3. Kendall et al. Diabetes Care 2005 1. DeFronzo et al. Diabetes Care 2005
Exenatide: 3 AMIGOS TrialsWeight changes After 30 weeks Add-on to SU(n=377) Add-on to MET+SU(n=733) Add-on to MET (n=336) Time (weeks) Time (weeks) Time (weeks) 0 10 20 30 0 10 20 30 0 10 20 30 0 -0.5 * * -1.0 * * ** -1.5 * * * Change in weight (kg) * * -2.0 * ** -2.5 ** -3.0 ** ** -3.5 Placebo BID Exenatide 5 µg BID Exenatide 10 µg BID ITT population; Mean (SE); *p<0.05 vs. placebo; * *p<0.001 vs. placebo 3. Kendall et al. Diabetes Care 2005 2. Buse et al. Diabetes Care 2004 1. DeFronzo et al. Diabetes Care 2005
Changes in A1C and Body Weight: Liraglutide, Exenatide and Sitagliptin = Lira-DPP-4 = LEAD-6 = Lira-DPP-4 = LEAD-6 Adapted from Niswender K et al, DiabObesMetab 2012 doi: 10.1111/j.1463-1326.2012.01673.x
SUs May Increase CV Risk in Patients with T2DM: In a meta‐analysis of 20 observational studies representing 1,311,090patients (median follow-up , 4.6 years), SUs were associated with a significantly increased risk of CV death and of a composite CV events compared with other oral diabetes drugs n = the total number of comparisons for that analysis; one study may contribute more than one comparison to the analysis CV composite = MI, stroke, CV-related hospitalization, or CV death Phung OJ, et al. Diabetes 2012;61:Suppl 1A. Abstract 2-LB 34
SUs May Increase Mortality and CV Risk versus Metformin • In a Danish study (n=107,806), monotherapy with glimepiride, glibenclamide, glipizide, and tolbutamide was associated with significantly increased all-cause mortality vs metformin in patients with and without previous MI • Results were similar for CV mortality and the composite CV end point Risk for All-Cause Mortality No Previous MI Previous MI Hazard Ratio (95% confidence interval) Hazard Ratio (95% confidence interval) Schramm TK, et al. Eur Heart J. 2011;32:1900-1908 35
All-cause Mortality a Increased Mortality with Sulfonylureas in Patients with DM2 May Be Dose-related In a retrospective cohort Canadian study of patients with newly diagnosed DM2 (n=12,272), first- or second-generation sulfonylurea monotherapy was associated with increased mortality in a dose-related manner a Either chlorpropamide or tolbutamide Simpson SH, et al. CMAJ2006;174:169-74 36
UKPDS 10-year Follow-up:Kaplan-Meier Curves for Outcomes Ins-SU End-pt 9% MI 15% Micro 24% Death 13% Met End-pt 21% MI 33% Micro NS Death 27% Legacy effect; benefit of early aggressive glycemic control on CVD outcomes Holman RR, et al. N Engl J Med 2008;359:1577-1589 Holman RR, et al. N Engl J Med 2008;359:1577-1589
CardioprotectiveEffects of GLP-1 • GLP-1 improves cardiac function in heart failure 1,2 • GLP-1 increases myocardial glucose uptake 3 • GLP-1 improves functional recovery following myocardial ischemia 4-6 • Incretins reduce infarct size 7-9 • GLP-1 improves endothelium dysfunction 10,11 1 Nikolaidiset al. Circulation 2004;110:955–61 2 Poornima I et al. Circ HeartFail. 2008;1:153-160 3 Zhao et al. J PharmacolExpTher 2006;317:1106–13 4 Nikolaidiset al. J. Pharm ExpTher 2005;312:303 5 Nikolaidis et al. Circulation 2004;109:962 6 Ban et al. Circulation 2008;117:2340 7 Bose A et al. Diabetes 2005;54:146 8 Noyan-Ashraf et al. Diabetes 2009;58:975 9 Sauve et al. Diabetes 2010;59:1063–73 10 Basuet al. Am J PhysiolEndocrinolMetab 2007;293:E1289–95 11 Nyströmet al. Am J PhysiolEndocrinolMetab 2004;287:E1209–15
GLP-1 Actions on the Heart: Direct or Indirect? Ussher J, Drucker DJ, Endocrine Rev. 2012 Apr;33(2):187-215.
GLP-1 Receptor Agonists Reduce BP LEAD 6 Systolic blood pressure: Liraglutide vs. Exenatide Buse J et al. Lancet 2009;374:39–47
Pre-treatment with Liraglutide Improves Survival Following MI Liraglutide 200 µg/kg Liraglutide 75 µg/kg Placebo Sham operation Overall survival Death due to cardiac rupture 100 20 16 80 Dead mice (n) 60 12 Survival (%) 40 8 20 4 0 2 4 6 8 10 12 14 16 0 5 10 15 20 25 30 Days Days n=60 per group Noyan-Ashraf et al. Diabetes 2009;58:975–83. MI, myocardial infarction
Pre-treatment with Liraglutide Reduces Infarct Size Arrows represent extent of infarct P < 0.05 30 Infarct (%) 20 10 0 Liraglutide Placebo Noyan-Ashraf et al. Diabetes 2009;58:975–83
GLP-1 Reduced Infarct Size in Isolated Rat Hearts 60 a a 40 a Infarct Within the Risk Zone, I/R% 20 0 Control PC VP Before Ischaemia GLP-1/VP as a PC Mimetic VP at Reperfusion GLP-1/VP at Reperfusion a P < 0.001 vscontrol PC, ischemic pre-conditioning; VP, valinepyrrolidide(inhibitor of GLP-1 breakdown) Bose AK et al. Cardiovasc Drugs Ther 2005;19:9-11
Control GLP-1 3-month GLP-1 Treatment Prolongs 12-month Survival In SHHF Rats 100 80 (72%) 60 Survival, % P<.005 SHHF, spontaneously hypertensive heart failure- prone rat 40 (44%) 20 0 1 2 3 4 5 6 7 8 9 10 11 12 Weeks of Treatment Poornima I et al. Circ Heart Fail. 2008;1:153-160 45
Mechanisms Underlying Potential CV Benefits of DPP-4 Inhibitors Fadini and AvogaroVascPharmacol 2011
Mice Lacking DPP-4 Have Improved Outcomes After Experimental MI DPP-4+/+ and DPP-4-/- mice Normal chow diet (7% fat) Age (weeks) 0 12 16 LAD ligation Endpoint: infarct size Dpp4+/+ and -/- sham (n=26) 100 (n=10) 20 90 (n=10) 15 Dpp4-/- LAD (n=31) 80 Survival (%) Infarct (%) 10 70 * 5 60 Dpp4+/+ LAD (n=26) 0 50 +/+ -/- 0 10 15 20 25 30 *p< 0.05 Dpp4 genotype Days post-MI • MI, myocardial infarction; LAD, left anterior descending artery Sauve et al. Diabetes 2010;59:1063–73
Effects of GLP-1 RA and DPP-4i on Mouse Renal Function WT Mice GLP-1r -/- Mice 0.4 0.4 0.4 0.4 40 50 40 50 * * 40 40 * * 0.3 0.3 0.3 0.3 30 30 * * * 30 30 Urinary flow rate (nmol/min/g) Urinary flow rate (µl/min/g) 20 20 0.2 0.2 0.2 0.2 Urinary flow rate (nmol/min/g) Urinary flow rate (nmol/min/g) Urinary flow rate (nmol/min/g) Urinary flow rate (µl/min/g) Urinary flow rate (µl/min/g) Urinary flow rate (µ/min/g) 20 20 0.1 0.1 0.1 0.1 10 10 10 10 0.0 0.0 0.0 0.0 0 0 0 0 Na K Cl Na K Cl Na K Cl Na K Cl Vehicle Exendin-4 Vehicle Vehicle Alogliptin Exendin-4 Vehicle Alogliptin Rieg T et al. Am J Physiol Renal Physiol2012;303(7):F963-71 *P<0.05 vs. vehicle. n=5–6 per group
Diabetic Mice with Pharmacological Inhibition of DPP-4 Have Increased Expression of Cardioprotective Proteins HFD, high-fat diet; STZ, streptozotocin; p-AKT, phosphorylated cell survival kinase p-AKT HSP90 HFD/STZ Sitagliptin Metformin Liraglutide p-AKT *** 25 *P < 0.05 ***P < 0.001 20 * 15 Relative units 10 5 0 Metformin Liraglutide HFD/STZ Sitagliptin Sauve et al. Diabetes 2010;59:1063–73
Downregulation of BNP Gene Expression Following DPP-4 Inhibition in Rats TGFb, TIMP, Col1α1 and Col3α1 are markers of fibrosis *P<0.05; **P<0.001 • Results suggest that DPP-4 inhibition leads to: • cardiac myocyte stress • Improved cardiac function Chaykovska L, et al. PLoSOne 2011;6(11):e27861
Effects of DM2 on Endothelial Progenitor Cells (EPCs) • The quantity and function of EPCs are diminished in patients with type 2 diabetes 1,2 • EPCs play an important role in cardiac tissue repair following ischemic events 3 • Preclinical data in animals show the homing of EPCs to sites of vascular injury is impaired in diabetes 4 • In patients with ischemic heart disease, there are a decreased number of bone marrow-derived circulating progenitor cells with further reductions in those with diabetes 5 • Hill JM, et al. N Engl J Med 2003;348:593-600 • Tepper OM, et al. Circulation 2002;106(22):2781-27866 • Zaruba M-M, et al. Cell Stem Cell 2009;4:313-323 • Li M, et al. Circ Res. 2006 Mar 17;98:697-704 • Bozdag-TuranI, et al. CardiovascDiabetol2011;10(1):107
Mechanism for DPP-4 Inhibition and SDF-1-mediated Improvements in Cardiac Function • Mobilisationwith • G-CSFTreatment Bone Marrow Ischemic myocardium CXCR + Stem cells Enhanced Homing by CD26 Inhibition Prevention of Cleavage- Enhanced Homing SDF-1 CXCR4 DPP-4 (CD26) Release of SDF-1 CXCR, chemokinereceptor G-CSF, granulocyte colony-stimulating factor SDF-1, stromal cell-derived factor Inhibition N-terminal Cleavage: DPP-4 (CD26) Diminished Homing CXCR4 SDF-1 Zaruba M-M, et al. Cell Stem Cell 2009;4:313-323 52