Download
1 / 5
50 likes | 52 Vues
Beta thalassaemia trait (BTT), a beta globin gene disorder share insulin resistance with Type 2 Diabetes Mellitus (T2DM). BTT may therefore be a risk factor for T2DM. We hypothesise that undiagnosed BTT could be a risk factor for T2DM.

E N D
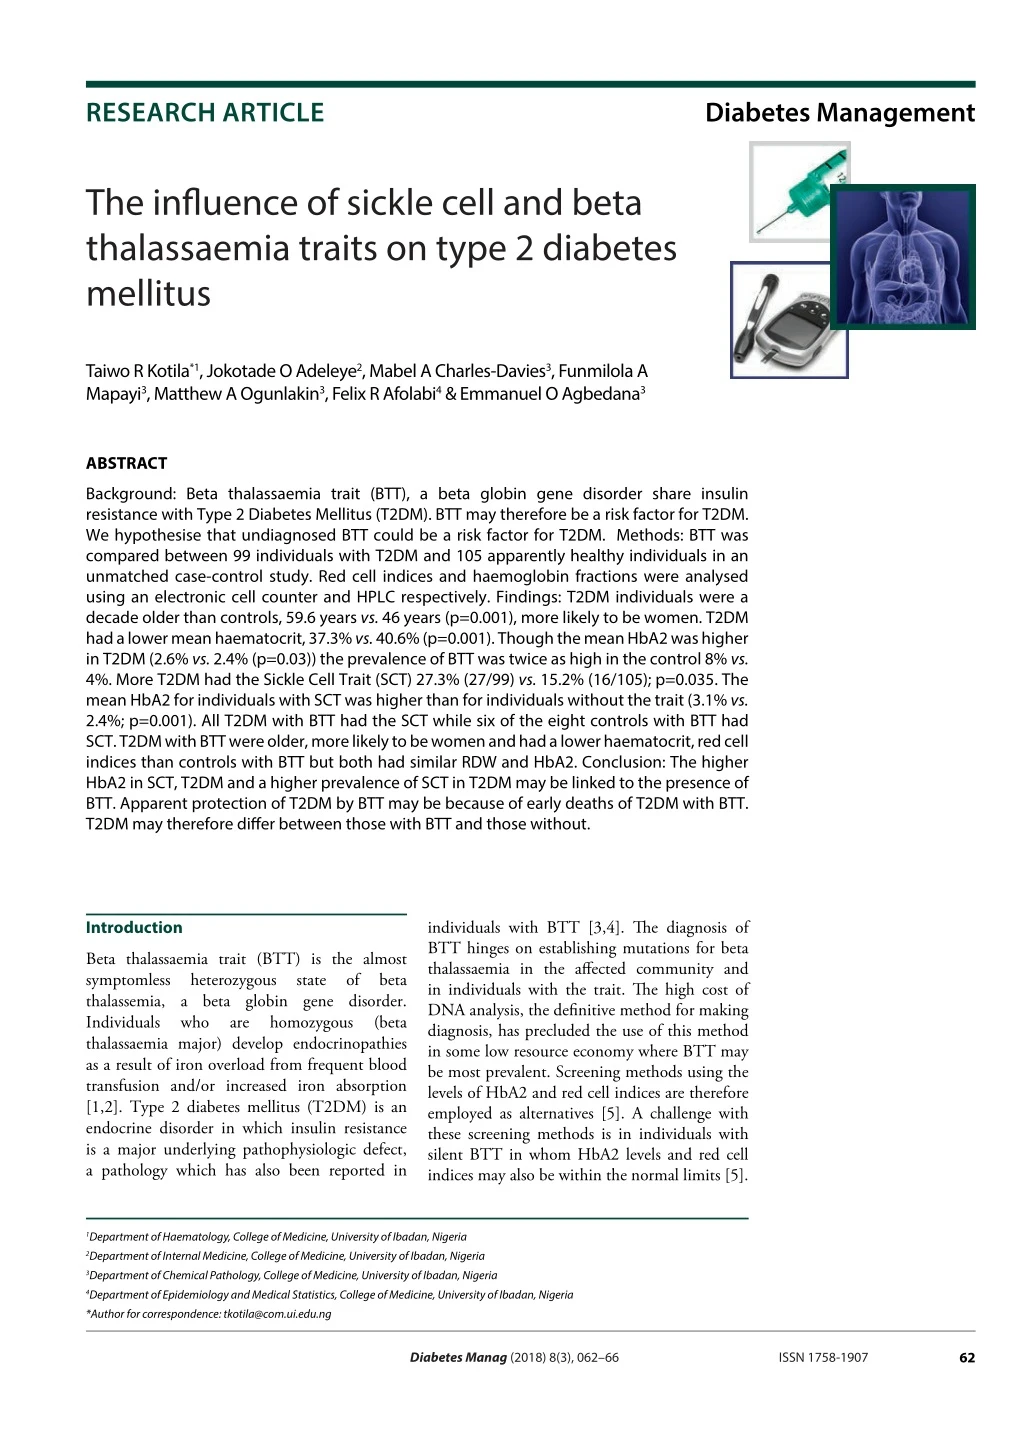
RESEARCH ARTICLE Diabetes Management The influence of sickle cell and beta thalassaemia traits on type 2 diabetes mellitus Taiwo R Kotila*1, Jokotade O Adeleye2, Mabel A Charles-Davies3, Funmilola A Mapayi3, Matthew A Ogunlakin3, Felix R Afolabi4 & Emmanuel O Agbedana3 ABSTRACT Background: Beta thalassaemia trait (BTT), a beta globin gene disorder share insulin resistance with Type 2 Diabetes Mellitus (T2DM). BTT may therefore be a risk factor for T2DM. We hypothesise that undiagnosed BTT could be a risk factor for T2DM. Methods: BTT was compared between 99 individuals with T2DM and 105 apparently healthy individuals in an unmatched case-control study. Red cell indices and haemoglobin fractions were analysed using an electronic cell counter and HPLC respectively. Findings: T2DM individuals were a decade older than controls, 59.6 years vs. 46 years (p=0.001), more likely to be women. T2DM had a lower mean haematocrit, 37.3% vs. 40.6% (p=0.001). Though the mean HbA2 was higher in T2DM (2.6% vs. 2.4% (p=0.03)) the prevalence of BTT was twice as high in the control 8% vs. 4%. More T2DM had the Sickle Cell Trait (SCT) 27.3% (27/99) vs. 15.2% (16/105); p=0.035. The mean HbA2 for individuals with SCT was higher than for individuals without the trait (3.1% vs. 2.4%; p=0.001). All T2DM with BTT had the SCT while six of the eight controls with BTT had SCT. T2DM with BTT were older, more likely to be women and had a lower haematocrit, red cell indices than controls with BTT but both had similar RDW and HbA2. Conclusion: The higher HbA2 in SCT, T2DM and a higher prevalence of SCT in T2DM may be linked to the presence of BTT. Apparent protection of T2DM by BTT may be because of early deaths of T2DM with BTT. T2DM may therefore differ between those with BTT and those without. Introduction individuals with BTT [3,4]. The diagnosis of BTT hinges on establishing mutations for beta thalassaemia in the affected community and in individuals with the trait. The high cost of DNA analysis, the definitive method for making diagnosis, has precluded the use of this method in some low resource economy where BTT may be most prevalent. Screening methods using the levels of HbA2 and red cell indices are therefore employed as alternatives [5]. A challenge with these screening methods is in individuals with silent BTT in whom HbA2 levels and red cell indices may also be within the normal limits [5]. Beta thalassaemia trait (BTT) is the almost symptomless heterozygous thalassemia, a beta globin gene disorder. Individuals who are thalassaemia major) develop endocrinopathies as a result of iron overload from frequent blood transfusion and/or increased iron absorption [1,2]. Type 2 diabetes mellitus (T2DM) is an endocrine disorder in which insulin resistance is a major underlying pathophysiologic defect, a pathology which has also been reported in state of beta homozygous (beta 1Department of Haematology, College of Medicine, University of Ibadan, Nigeria 2Department of Internal Medicine, College of Medicine, University of Ibadan, Nigeria 3Department of Chemical Pathology, College of Medicine, University of Ibadan, Nigeria 4Department of Epidemiology and Medical Statistics, College of Medicine, University of Ibadan, Nigeria *Author for correspondence: tkotila@com.ui.edu.ng 62 Diabetes Manag (2018) 8(3), 062–66 ISSN 1758-1907
RESEARCH ARTICLE Kotila, Adeleye, Charles-Davies, et al. KEYWORDS Therefore the disorder may remain undiagnosed in such individuals who may continue to manifest its complications. This challenge and the need to differentiate microcytosis and hypochromia arising from iron deficiency and that due to BTT are reasons why different formulae were developed [6-10]. Most of these formulae use a combination of the red cell indices, red cell count and red cell distribution width in their derivations. Evaluation of the different formulae has found the red cell distribution width index [11] and the Mentzer index [12] sufficiently discriminatory in the diagnosis of BTT. This study sought to compare the prevalence of BTT in patients with T2DM and apparently healthy controls using some of the different screening methods. We hypothesise that undiagnosed BTT could be a risk factor for T2DM. (FPG) assay. Controls who gave a history of treatment for T2DM or had FPG of greater than 110 mg/dl were not included in the analyses. The diagnosis of BTT was based on HbA2 of ≥ 3.5%, also the following formulae and their appropriate cut-offs were employed in the diagnosis of BTT, 1. Red cell Distribution Width Index (RDWI) = MCV × RDW/RBC 2. Mentzer Index (MI) = MCV/RBC 3. Srivastava index (SI) = MCH/RBC A value less than 220, 13, 3.8 is suggestive of BTT for RDWI, MI, SI respectively Ethical Consideration: The proposal for the study was reviewed and approved by the joint University of Ibadan and University College Hospital, Ibadan ethical committee. The study was conducted in compliance with the declaration of Helsinki. Statistical Analysis: Statistical analysis was performed using STATA version 13 (StataCorp, College Station, Texas). ■ prevalence ■ red cell indices ■ risk factors Methods This is an unmatched case-control study of 99 individuals with T2DM and 105 apparently healthy individuals. Both groups had a complete blood count and haemoglobin fractions analysed after giving informed consent. This was done using a five parameter particle counter (SYSMEX XS1000i model) and BioRad ® HPLC analyser (variant II) respectively. The cases were individuals already diagnosed with T2DM and who were being followed up in a tertiary health facility while the controls were selected from the workforce in the same hospital. All participants had venous blood samples taken for Fasting Plasma Glucose Results Demographics Individuals with T2DM were more than a decade older than the apparently healthy controls 59.6 years vs. 46 years (p=0.001), the age distribution is shown in the FIGURE1. There were more women in both groups 74% (72/97) vs. 26% (25/97); 57% (59/103) vs. 43% (44/103) for T2DM and control respectively. Figure 1. Age Distribution of Cases and Controls 63 Diabetes Manag (2018) 8(3)
Research Article The influence of sickle cell and beta thalassaemia traits Clinical features of haemolysis The prevalence of BTT was also twice as high in the control compared to T2DM using either the Mentzer or Srivastava index (2.0% vs. 4.8%, both MI and SI gave same prevalence). The Red Cell Distribution Width index gave a higher prevalence than either MI or SI, but the prevalence was still higher in control than in T2DM 11.6% vs. 14.3%. T2DM were more likely to be transfused (20/84) 23.8% vs. (6/99) 6%; p=0.001) though there was no difference in the degree to which both groups reported a previous history of jaundice (8.7% (8/92) vs. 7% (7/93); p=0.66) but T2DM individuals reported passing dark coloured urine (haemoglobinuria) less frequently than the control (16.3% (14/86) vs. 23.5% (23/98): p=0.23). Discussion This study shows that BTT may be protective of T2DM with the prevalence being twice as high among the apparently healthy controls in comparison to individuals with diabetes mellitus. It was also observed that SCT was almost twice as common among T2DM compared to the healthy controls. In addition, individuals with SCT were more likely to have BTT. It therefore appears that the high prevalence of SCT in T2DM may be associated with the presence of BTT, especially since all T2DM and majority of healthy controls with BTT have the SCT. Therefore, a reason why BTT may appear to be protective of T2DM rather than being a risk factor despite some common features between both disorders and a high HbA2 in T2DM and SCT could be that some T2DM individuals with BTT may have died before reaching middle age. This could also be inferred from the fact that the T2DM individuals were mostly in the middle age and were a decade older than the controls. Again, T2DM with BTT were more than one decade older than the healthy controls with BTT (TABLE 1). The 95% confidence interval of the odds ratio for BTT also shows that not only could the risk for BTT be reduced by 85% but it could also be almost as high as twice in T2DM compared to controls. The mean parameter for some of the haematological parameters (MCH, MCV and RDW) in both groups are within the range expected for BTT. It could therefore be that some individuals with BTT (silent carriers) were missed in both groups. The degree to which this affected each group could not be ascertained. Similar to our study, carrier state for the sickle cell gene was found to be more common in T2DM than is expected in the general population [13]. Though this is at variance with a study from Sub-Saharan Africa (Cameroon) which did not find any difference in the prevalence of SCT compared to that of the general population [14]. The prevalence of SCT observed in T2DM in our study, though similar to that in the community which is usually between 25-30% [15,16] differ significantly from that found in the control Haematological variables T2DM had a lower haematocrit (Hct) than control, 37.3% vs. 40.6% (p=0.001). Though the Mean Corpuscular Haemoglobin (MCH) and Mean Corpuscular Volume (MCV) were similar in both groups (25.7 vs. 25.8 (p=0.5); 84.4 vs. 85.6 (p=0.07), the red cell distribution width (RDW) differed between the groups, being higher in the control 14.9 vs. 14.6; p=0.01. Also, the mean HbA2 was significantly different, 2.6% vs. 2.4 % (p=0.03) between T2DM and control respectively. The prevalence of BTT was twice as high in the control 8% vs. 4% (odds ratio = 0.51 [95% CI 0.15, 1.75; p=0.3]) using a cut-off of ≥ 3.5%. After adjusting for both gender and age, the odds ratio reduced to 0.33 (95%CI 0.07, 1.47; p=0.1). Adjustment for gender alone reduced the odds ratio to 0.50 (95%CI 0.14, 1.75; p=0.3) while adjustment for age alone reduced the ratio to 0.34 (95%CI 0.8,1.5; p=0.2). However, the prevalence was similar when the cut-off of ≥ 3.3% used by the HPLC analyser was applied (13.1% vs. 13.3%). There were moreT2DM with the sickle cell trait (HbAS) than apparently healthy controls with the trait 27.3% (27/99) vs. 15.2% (16/105); p=0.035. The odds of an individual with SCT having BTT was 24 times that of an individual without SCT, OR= 24.09 (95%CI 5.04, 115.07), p<0.001. The mean HbA2 for individuals with the sickle cell trait was significantly higher than for individuals without the trait (3.1% vs. 2.4%; p=0.001). A comparison of the haematological profile of T2DM with BTT (N=4) and healthy control with BTT (N=8) showed that T2DM with BTT were older, more likely to be women and had a lower Hct, MCH and MCV but similar RDW and HbA2 (TABLE 1). All T2DM with BTT had the sickle cell trait while 6 of the 8 apparently healthy controls with BTT had the sickle cell trait. Prevalence based on the derived formulae 64
RESEARCH ARTICLE Kotila, Adeleye, Charles-Davies, et al. Table 1. A Comparison of Demographics and Haematological Parameters of T2DM Individuals with Beta Thalassaemia Trait and Apparently Healthy Controls with Beta thalassaemia Trait Healthy controls with BTT (N=8) 46.9 ± 3.6 3:5 39.3 ± 2.9 Variables (Mean) T2DM with BTT (N=4) P value Age (years) Sex (M:F ratio) Haematocrit (%) 62.2 ± 15.2 1:3 36.8 ± 5.4 0.009 0.6 0.1 Mean Corpuscular Haemoglobin (pg) Mean Corpuscular Volume(fl) HbA2 (%) Red Cell Distribution Width (%) 22.7 ± 3.1 25.7 ± 1.6 0.02 76.1 ± 7.8 3.6 ± 0.1 15.2 ± 1.2 84.4 ± 5.7 3.8 ± 0.2 15.3 ± 2.0 0.03 0.07 0.5 Beta thalassaemia trait was diagnosed using HbA2 of 3.5% as cut-off group. It therefore appears that the apparently healthy controls may not be representative of the community. This discrepancy may be as a result of healthy workers’ effect since most of the controls were from the workforce of the hospital where the cases were drawn. A significantly higher mean HbA2 in individuals with T2DM and also in those with the sickle cell trait would suggest the likelihood of a higher prevalence of BTT in individuals with T2DM and those with the sickle cell trait [17]. However, high HbA2 in sickle cell trait has previously been attributed to inaccurate quantitation of HbA2 in the presence of the haemoglobin S [18]. We are of the opinion that the high HbA2 and high prevalence of the sickle cell trait among individuals with T2DM is more likely due to the presence of BTT, especially since all T2DM with BTT had the sickle cell trait while six of the eight controls with BTT had the trait. The prevalence obtained using the Mentzer index was the same as using the Srivastava index, possibly because the difference in the two formulae is the substitution of MCH with MCV by Srivastava, two red cell indices which mostly often follow the same trend. The prevalence of about 13% was obtained using HbA2 cut-off (3.3%) which was flagged as abnormal by the HPLC analyser, a prevalence which is also similar to that obtained using the RDWI. All these show the difficulty in making a diagnosis of BTT in the absence of molecular techniques. Previously, a BTT prevalence of 26% was obtained from the same community where this study was done in apparently healthy controls by elution from cellulose acetate paper and using a cut off of ≥ 3.5% [19,20]. A prevalence of 11% was also obtained from patients with sickle cell anaemia from the same population using an HPLC analyser similar to that used in this study and a cut-off of 4.0% [21]. This shows that analysis of haemoglobin fractions by automation has not solved the difficulty associated with making the diagnosis of BTT in the absence of molecular methods. Matching the cases with the control using age and sex would have reduced the effects of age and sex as possible confounders. But matching by age and sex would have also precluded studying the effect of these characteristics on the association. More so, gender disparities have been observed in individuals who have diabetes and sickle cell trait compared to those without the trait. It was observed that men who have both SCT and T2DM have a significantly higher risk ratio for complications (proteinuria and retinopathy) than T2DM men without the trait. However, this difference was absent in female patients [22]. The same study from Cameroon (which did not observe a difference in the prevalence of sickle cell trait from that obtained in the community) also noted that individuals with diabetes and sickle cell trait were about a decade older than the non-trait patients [14]. This is similar to the age difference between T2DM with BTT and healthy controls with BTT in this study. It could be inferred that the differences between T2DM with BTT and the healthy controls with BTT (TABLE 1) may possibly be due to a difference in the disease in the two groups. This hypothesis is supported by the observation of a higher prevalence of diabetes in thalassemia patients who are homozygous for the IVS-II-745 mutation. This made the authors to infer that an underlying genetic defect in thalassaemia patients is contributory to the development of endocrine complications in them [23]. Similarly, a rare β -globin gene mutation (IVS-II-837) was noticed to be common in asymptomatic carriers of beta thalassaemia while screening individuals suspected to have diabetes [24]. It would therefore be of interest to study the pattern of sickle cell trait in T2DM who are younger than those in the present study and also in individuals with type 1 diabetes mellitus. The limitations to 65 Diabetes Manag (2018) 8(3)
Research Article The influence of sickle cell and beta thalassaemia traits our study are failure to confirm the presence of beta thalassaemia mutations in the individuals presumed to have the beta thalassaemia trait at the molecular level and the small sample size of the study. T2DM with BTT in comparison with healthy controls with BTT. The apparent protection of T2DM by BTT may be because of early deaths before middle age by individuals with T2DM and BTT. Conclusion Acknowledgment This study shows that the prevalence of SCT is higher among T2DM individuals than apparently healthy control suggesting an association between T2DM and SCT. The higher prevalence of SCT among T2DM may be as a result of BTT since all T2DM with BTT and majority of controls with BTT had the sickle cell trait. The disease may also differ between This work was supported by the University of Ibadan Research Foundation (UIRF) (SEC/ UIRF/CRG/001). Declaration of Interests Authors declare no conflict of interest. References incorporating volume dispersion for differentiating iron deficiency anaemia from thalassaemia minor. Blood Cells. 15(3), 481-495 (1989). 18. Head C, Conroy M, Jarvis M et al. Some observations on the measurement of Haemoglobin A2 and S percentages by high performance liquid chromatography in the presence and absence of α thalassaemia. J. Clin. Pathol. 57(3), 276-280 (2004). 1. Muncie H, Campbell J. Alpha and beta thalassaemia. Am. Fam. Physician. 80(4), 339-344 (2009). 11. Ullah Z, Khattak A, Ali S et al. Evaluation of five discriminating indexes to distinguish beta thalassaemia trait from iron deficiency anaemia. J. Pak. Med. Assoc. 66(12), 1627-1631 (2016). 2. Rund D, Rachmilewitz E. Beta-thalassaemia. N. Engl. J. Med. 353(11), 1135-1146 (2005). 19. Kotila T, Adeyemo A, Mewoyeka O et al. Beta thalassaemia trait in Western Nigeria. Afr. Health Sci. 9(1), 46-48 (2009). 3. Bahar A, Kashi Z, Sohrab M et al. Relationship between beta-globin gene carrier state and insulin resistance. J. Diabetes Metab. Disord. 11(1), 22-26 (2012). 12. Vehapoglu A, Ozgurhan G, Demir A et al. Hematological indices for differential diagnosis of beta thalassaemia trait and iron deficiency anaemia. Anaemia. 576738 (2014). 20. Kotila T. Beta thalassaemia trait in Nigeria: Myth or fact? Afr. J med Med. Sci. 42(3), 261-264 (2013). 4. Tong P, Ng M, Ho C et al. C-reactive protein and insulin resistance in subjects with thalassaemia minor and a family history of diabetes. Diabetes. Care. 25(8), 1480-1481 (2002). 13. Goldsmith J, Bonham V, Joiner C et al. Framing the research agenda for sickle cell trait: building on the current understanding of clinical events and their potential implications. Am. J. Hematol. 87(3), 340-346 (2012). 21. Adeyemo T. Ojewunmi O, Oyetunji A. Evaluation of high chromatography (HPLC) pattern and prevalence of beta-thalassaemia trait among sickle cell disease patients in Lagos, Nigeria. Pan. Afr. Med. J. 18, 71 (2014). performance liquid 5. British in Haematology (BCSH). Guidelines for investigation of α and β thalassaemia trait. J. Clin. Pathol. 47(4), 289-95(1994). Committee for Standardization 14. Ama V, Kengne A, Nansseu N et al. Would sickle cell trait influence the metabolic control in Sub- Saharan individuals with type 2 diabetes. Diabet. Med. 29(9), e334-337 (2012). 22. Ajayi A, Kolawole B. Sickle cell trait and gender influence type 2 diabetic complications in African patients. Eur. J. Intern. Med. 15(5), 312-315 (2004). 6. England J, Fraser P. Differentiation of iron deficiency from thalassaemia trait by routine blood count. Lancet. 1(7801), 449-452 (1973). 15. Omotade O, Kayode C, Falade S et al. Routine screening for sickle cell haemoglobinopathy by electrophoresis in an infant welfare clinic. West. Afr. J. Med. 17, 91-94 (1998). 23. Al-Akhras A, Badr M, El-Safy U, et al. Impact of genotype on endocrine complications in β- thalassaemia patients. Biomed. Rep. 4(6), 728-736 (2016). 7. Srivastava P, Bevington J. Iron deficiency and/or thalassaemia trait. Lancet. 1(7807), 832 (1973). 16. Nnaji G, Ezeagwuna D, Nnaji I et al. Prevalence and pattern of sickle cell disease in premarital couples in Southeastern Nigeria. Niger. J. Clin. Pract. 16(3), 309-314 (2013). 8. Mentzer W. Differentiation of iron deficiency from thalassaemia trait. Lancet. 1(7808), 882 (1973). 24. Bashyam M, Chaudhary A, Bhat V. The IVS- II-837 (T>G) appears to be a relatively common ‘rare’ β-globin gene mutation in β-thalassaemia patients in Karnataka State, South India. Hemoglobin. 36(5), 497-501 (2012). 9. Shine I, Lal S. A strategy to detect β thalassaemia minor. Lancet. 1 (8013), 692-694 (1977). 17. Kotila T. Sickle cell trait: a benign state? Acta Haematol. 136(13), 147-151 (2016). 10. Green R, King R. A new red cell discriminant 66