EMCal simulations
This presentation focuses on the detailed simulations of positron (e+) and muon (μ+) beams using EMCal, emphasizing energy loss, detector responses, and hit simulations. It introduces the setup, improved geometries, and digitization methods for better accuracy in assessing the behavior of these beams through matter. Discussion includes energy ranges, initial beam characteristics, and results from the G4MICE simulation framework. The findings assist in understanding particle identification (PID) strategies and separation techniques between electrons and muons, critical for future experiments.

EMCal simulations
E N D
Presentation Transcript
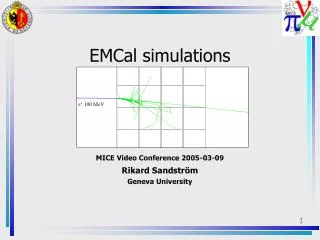
e+ 100 MeV EMCal simulations MICE Video Conference 2005-03-09 Rikard Sandström Geneva University
Outline • Introduction to setup • Beams • Improved geometry & digitization • Simulation of hits • Monochromatic beams of e+ and µ+ • Energy loss • Ranges • Detector response (Digitization) • Using digits to separate mu from e. • Wrap-up
Beams • For a start, will compare monochromatic e+ & µ+ beams: • 100, 150, 200 MeV/c. • The “real” beam: • A Tilley TURTLE beam, fed into G4MICE by Malcolm. • Starting at z = -5800 mm (before upstream SciFi) in G4MICE. • Initial energy 231.6 MeV (see plot). • Found a small bug: • CKOV2 windows material • Etot = 208.5 +- 2.8 MeV when leaving downsteam tracker. • With TOF and CKOV Etot ~ 185 MeV at EMCal. • 0.22 X0 between downstream tracker and EmCal -> 20 MeV. • TOF 6 MeV, CKOV windows 13 MeV. • Steve is fixing it.
40 mm 0.5 mm 1.35 mm 0.3 mm Improved geometryand digitization • Added air gap (holes) between lead and fibers. • (Pictures from G4MICE.) • Added incomplete gamma functions to integrate over the signal. • With cuts on open gate etc.
Initial mu+ hit 2nds Energy deposited by real beam E lost in TOF & CKOV
1st to 2nd layer 2nd to 3rd layer Total energy, real beam MeV mu+ 2nds z [mm] Note that the fiber structure is visible.
1st to 2nd layer Hit position, real beam Black = mu+ only Red = total
Hit position, 200 MeV/c e+ beam Fitted with Landau, shower maxima at 22 mm.
Range, muons • Checks suggested by Ludovico Tortora. • Result: Makes sense to me. • Checked muon ranges with PDG for: • Pure lead • Pure polystyrene • Compound material (lead+polystyrene @ 5.645 g/cm2 ~1:1 ratio) • Lead, mu+ 222 MeV/c: • PDG: 8.22 cm • G4MICE: 8 cm • Polystyrene, mu+ 100 MeV/c: • PDG: 7.37 cm • G4MICE: 6.7 cm • Compound material (real), mu+ 222 MeV/c: • PDG1: max 16.5 cm • G4MICE: 14 cm Boundaries 1 Calculating true density, treating it as Pb. (Polystyrene would shorten range.)
Range, EM-cascades • No good theory exist (Passage of particles through matter) • X0(Pb) = 0.56 cm • Xshower(Pb) = 2 X0 = 1.12 cm (average) • In G4MICE, 200 MeV/c e+: dzMPV(Pb) = 1.312±0.002 cm • EGSnrc (basis for PDG’s “Passage of particles…”) • Lead 45.2%, fibers 49.7% of EMCal volume. • 16 cm EMCal = 7.232 cm lead. • Rest is air gap between lead and fibers. • 200 MeV/c, 7.232 cm Pb (treating fibers & air gaps as vacuum) -> • 0.88% energy reflected • 95.27% energy deposited • 3.844% energy transmitted
Well, what about the fibers? • Extreme case, all lead (16 cm): • EGSnrc gives-> • 1.0% energy reflected • 99.0% energy deposited • 0.058% energy transmitted • Even if we overestimate the amount of lead, a 200 MeV/c e+ still showers through sometimes. • G4MICE: 4.2% of the energy of a 200 MeV/c e+ beam is neither deposited in lead nor fiber. • Lead-only in EGSnrc: 4.7%. • Did not could energy lost in the air gaps. • According to EGSnrc 1% should be lost to upstream. • Still ~3% showers through.
Comments, and PID ideas • Passage of particles through matter: • “The number of particles crossing a planeis sensitive to the cutoff energy[...]. The electron number falls off more quickly than energy deposition. This is because, with increasing depth, a larger fraction of the cascade energy is carried by photons.” • I don’t see this since we cut well below Ecrit. • The hit position wrt layer is very characteristic for mu+ compared with e+ • Thus also for digits. • Expected range (or barycenter) should be used for PID. • On all following slides: • Muon beam • Positron beam µ+ e+ 4 1 2 3
Hit deposition, fiber/lead (200 MeV/c) Edep fiber/lead is constant for muons, and different for e and µ. Fibers sees electrons, photons convert in lead, fiber/lead dep decreases with z.
ADC in each layer (200 MeV/c) Should look similar to the hits on previous page (and does).
Plotting A against B (My “Alessandra plots”, all preliminary.) • Visual representation of e-mu separation. • Using log scaled sizes of “z” values. + More colour -> Old professors can see my results. - Gives impression that the peaks melt into each other more than they actually do. • Higher statistics looks worse in terms of separation. • Modest green line = 2D Gaussian fit. • Indicated fit results are • p0 = norm, p1 =xmean, p2 = xsigma, p3 = ymean, p4 = ysigma, p5 = correlation. • Gaussian/Gaussian != Gaussian, but a Cauchy distribution. • In principle, could make 3D plots with [ADC1]:[Total ADC] :[Barycenter] • Or why not a 4D fit with ADC2 in addition?
Separation, based on layer 1 200 MeV/c
Separation, based on layer 2 200 MeV/c
Barycenter vs total ADC 200 MeV/c
At lower momenta (#1) 200 MeV/c • No difference in total ADC at low p. • Variables used for PID have an ideal p-range. • Algorithm should use many variables for robustness. 150 MeV/c 100 MeV/c
At lower momenta (#2) 100 MeV/c 150 MeV/c • Barycenter separation gets worse, but… • At very low p muons are confined in first layer, whereas a shower is not. • At 150 MeV/c ADC counts in layer 2 looks best. 150 MeV/c
Comments on results • Some improvements and cross-checks needed: • No noise. • No decay. • No cutoff in time. • Made the open gate very long to isolate problems. • Total ADC etc is sum of all channels. • Also left-right of same cell. • I tried using a product of left-right ADC counts instead of a sum, but saw no improvement. • Difference in E-dep between e/mu might motivate decision on lead to fiber ratio. • I verified that this difference does not on simulation Ecutoff. • It looks like PID is good with this design. • Algorithm can use the same method on both 1st and 2nd layer and compare. • Muons are “point like”, i.e. well defined and predictable. • Longitudinal and total energy deposition seem powerful test variables. • ADC1, ADC2, totalADC, barycenter. • Need to investigate 200-260 MeV/c range to see if we need a 5th layer.
Transverse hit positions • NB: No use was made yet of transverse properties. • Will be used together with extrapolated tracks from tracker. • G4 meeting yesterday: • Next Geant4 patch will include improved transverse position for EM-showers. • Crossed cell planes or parallel?
Future plans • Identify, choose, and weight good PID variables. • Will require the measured momentum px, py, pz (from tracker) and calculating expected signals in EMCal. • Write the EMCal reconstruction in G4MICE. • Should give information to global PID (tracker, TOF, etc) in format adequate for statistical combination. • Report on actual e-mu separation efficiency. • Tune time variables (open gate, trigger delay etc). • When new event structure in G4MICE is ready, run with real spill, real beam, with decay.