PLOTTING LINES AND PLANES ON A STEREONET CONTD.
160 likes | 1.03k Vues
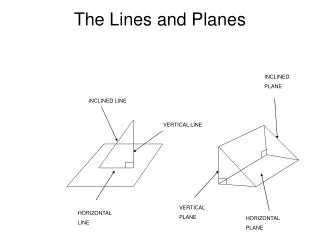
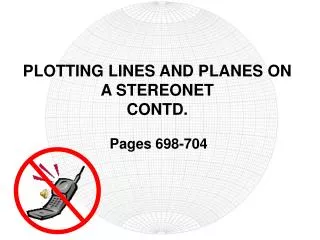
PLOTTING LINES AND PLANES ON A STEREONET CONTD. . Pages 698-704 . Plotting a plane by its dip and dip direction on a stereonet. Dip = inclination of the line of greatest slope on an inclined plane Refers to TRUE DIP as opposed to APPARENT DIP of a plane 0 ≤ apparent dip <true dip

PLOTTING LINES AND PLANES ON A STEREONET CONTD.
E N D
Presentation Transcript
PLOTTING LINES AND PLANES ON A STEREONET CONTD. Pages 698-704
Plotting a plane by its dip and dip direction on a stereonet • Dip = inclination of the line of greatest slope on an inclined plane • Refers to TRUE DIP as opposed to APPARENT DIP of a plane • 0 ≤ apparent dip <true dip • Dip direction is ALWAYS perpendicular to strike direction • The dip and dip direction of an inclined plane completely defines its attitude • Plotted the same way as lines
Plotting dip lines of planes on stereonet (lab 3, 9/21-23) Plot the dip lines to the planes with the given attitude • Strike • 342 • N35W • S27W • 132 • 278 • N25E Dip/dip direction 38NE 57SW 43SE 65SW 23N 71NW
Plotting dip lines of planes on stereonet (lab 3, 9/21-23) • Dip direction • 357.5 • 17.5 • 282.5 • 112.5 • 77.5 • 330.5 • 55.5 Dip amount 67 58 59 26 90 58 23 Data from: Rock-fall Hazard Assessment of the Aspen Forest Trail, Navajo National Monument, Arizona U. S. Geological Survey Open-file Report 00-305, 2000 http://pubs.usgs.gov/of/2000/ofr-00-0305/
Constructing Markland test plots using stereonets • On the tracing paper where you plotted the dip lines, draw a circle representing a cone making 60° angle around a vertical axis. This circle represents all planes dipping 30° • Similarly draw a circle representing all planes dipping 35° and 60°. The 35° circle represents all planes at the critical friction angle (anything dipping more than that has the potential for failure)
What’s the point? Data from: Rock-fall Hazard Assessment of the Aspen Forest Trail, Navajo National Monument, Arizona U. S. Geological Survey Open-file Report 00-305, 2000 http://pubs.usgs.gov/of/2000/ofr-00-0305/
Markland test plots using stereonets • On the same tracing paper plot: • Slope face 1 as a great circle (dip direction 003, dip angle 65 • If a plane has dip value greater than the friction angle and less than the slope angle, then sliding along the plane is possible. Such planes will fall within the “critical zone” bound by the intersection of the friction circle and the slope face great circle. • Determine the potential for rockfall hazard based on your plot
Interpretation: Rockfall or no rockfall? Data from: Rock-fall Hazard Assessment of the Aspen Forest Trail, Navajo National Monument, Arizona U. S. Geological Survey Open-file Report 00-305, 2000 http://pubs.usgs.gov/of/2000/ofr-00-0305/
Interpretation: Rockfall or no rockfall? Data from: Rock-fall Hazard Assessment of the Aspen Forest Trail, Navajo National Monument, Arizona U. S. Geological Survey Open-file Report 00-305, 2000 http://pubs.usgs.gov/of/2000/ofr-00-0305/
Interpretation: Rockfall or no rockfall? Data from: Rock-fall Hazard Assessment of the Aspen Forest Trail, Navajo National Monument, Arizona U. S. Geological Survey Open-file Report 00-305, 2000 http://pubs.usgs.gov/of/2000/ofr-00-0305/
Steps for determining the orientation of the line of intersection of two planes (page 703): We will use the example given in the text and determine the trend and plunge of the line of intersection of the planes N49E/42SE and N10W/65NE. • Plot both planes as great circles and label them. • The line of intersection of those two planes is the point where the great circles meet. Label this point.
Rotate the tracing paper in such a way that this point lies on the NS straight line. Draw a straight line from this point along the NS straight line all the way to the outside circle. This line represents the vertical plane passing through the line of intersection and will give you the TREND for that line. Count off the small circle intercepts between this point and the equatorial plane (the outside circle) along the NS straight line. This will give you the PLUNGE AMOUNT for the line of intersection.
Now rotate the tracing paper back to the original position (the point marked NORTH on the tracing paper coinciding with the top of the stereonet). Determine where the straight line segment you drew for step 3 intersects the equatorial plane. This is the TREND for the line of intersection.
Identify the line of intersection of the following planes • Strike • 342 • S27W • N35W • 278 • 132 • N25E Dip/dip direction 38NE 43SE 57SW 23N 65SW 71NW Pair #1 Pair #2 Pair #3
Identify the line of intersection of the following planes • Dip direction • 17.5 • 112.5 • 55.5 • 282.5 • 357.5 • 330.5 Dip amount 58 26 23 59 67 58 Pair #1 Pair #2 Pair #3