QTL Mapping for Salt Tolerance in Wheat: Enhancing Yield Through DNA Marker Technology
This study focuses on QTL mapping for enhancing salt tolerance in wheat through DNA marker-assisted selection (MAS). Using a doubled haploid population derived from contrasting parent lines (Kharchia 65 and TW 161) known for differential sodium uptake under salt stress, we conducted morpho-physiological studies and genotyped 99 lines with RFLP, AFLP, and SSR markers. The analysis included yield components and ionic contents under 100mM and 200mM NaCl stress. Our findings reveal significant QTLs linked to yield traits, aiming to support breeding programs for salt-tolerant wheat varieties.

QTL Mapping for Salt Tolerance in Wheat: Enhancing Yield Through DNA Marker Technology
E N D
Presentation Transcript
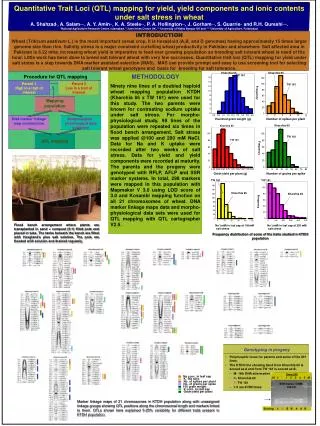
Parent 1 High in a trait of interest Parent 2 Low in a trait of interest x Mapping population DNA marker linkage map construction Morphological / physiological data collection QTL mapping Quantitative Trait Loci (QTL) mapping for yield, yield components and ionic contents under salt stress in wheat A. Shahzad*, A. Salam****, A. Y. Amin**, K. A. Steele***, P. A. Hollington***, J. Gorham***, S. Quarrie** and R.H. Qureshi****. *National Agriculture Research Centre, Islamabad, **John Innes Centre UK, ***University of Wales Bangor UK and ****University of Agriculture, Faisalabad. Genotyping in progeny INTRODUCTION Wheat (Triticum aestivum L.) is the most important cereal crop. It is hexaploid (A,B, and D genomes) having approximately 15 times larger genome size than rice. Salinity stress is a major constraint curtailing wheat productivity in Pakistan and elsewhere. Salt affected area in Pakistan is 6.22 mha. Increasing wheat yield is imperative to feed ever growing population so breeding salt tolerant wheat is need of the hour. Little work has been done to breed salt tolerant wheat with very few successes. Quantitative trait loci (QTL) mapping for yield under salt stress is a step towards DNA marker assisted selection (MAS). MAS can provide prompt and easy to use screening tool for selecting salt tolerant wheat genotypes and basis for breeding for salt tolerance. Kharchia 65 Kharchia 65 Procedure for QTL mapping METHODOLOGY Ninety nine lines of a doubled haploid wheat mapping population KTDH (Kharchia 65 x TW 161) were used for this study. The two parents were known for contrasting sodium uptake under salt stress. For morpho-physiological study, 99 lines of the population were repeated six times in flood bench arrangement. Salt stress was applied @100 and 200 mM NaCl. Data for Na and K uptake were recorded after two weeks of salt stress. Data for yield and yield components were recorded at maturity. The parents and the progeny were genotyped with RFLP, AFLP and SSR marker systems. In total, 298 markers were mapped in this population with Mapmaker V 3.0 using LOD score of 3.0 and Kosambi mapping function on all 21 chromosomes of wheat. DNA marker linkage maps data and morpho-physiological data sets were used for QTL mapping with QTL cartographer V2.5. TW 161 TW 161 Frequency Hundred grain weight (g) Number of spikes per plant Kharchia 65 Kharchia 65 TW 161 TW 161 Frequency Grain yield per plant (g) Number of grains per spike TW 161 TW 161 Kharchia 65 Kharchia 65 Frequency Flood bench arrangement where plants are transplanted in sand + compost (3:1) filled pots and placed in tubs. The tanks beneath the bench are filled with Hoagland’s plus salt solution. The pots are flooded with solution and drained regularly. Na+ (mM) in leaf sap at 100mM salt stress Na+ (mM) in leaf sap at 200 mM salt stress Frequency distribution of some of the traits studied in KTDH population • Polymorphic locus for parents and some of the DH lines. • The KTDH line showing band from Kharchia 65 is scored as A and from TW 161 is scored as B. • M- 1Kb DNA size marker • K- Kharchia 65 • T- TW 161 • 1-5 are KTDH lines Gwm 249 M KT 1 2 3 4 5 M Na conc. in leaf sap K / Na ratio No. of spikes per plant No. of grains per spike SSR marker GWM-249-2A 100 grain weight K conc. In leaf sap Grain yield per plant Marker linkage maps of 21 chromosomes in KTDH population along with unassigned linkage groups showing QTL positions along the chromosomal length and markers linked to them. QTLs shown here explained 5-25% variability for different traits present in KTDH population. ScoringAB B B A A B