Download
1 / 24
240 likes | 264 Vues
Explore rock crystallization behavior using experimental, phase diagram, and numerical methods. Classify rocks based on chemical composition and interpret diagrams. Develop skills in Excel data analysis and interpreting phase diagrams.

E N D
Geochemistry Lab Exercise:Crystallization of Magmas John C. Ayers Vanderbilt University
Objectives • Use three methods to explore the crystallization behavior of a rock of known composition at 1 atmosphere pressure: • Experimental method: Melt your rock at 1300°C and then cool it to 1000°C using a programmable glass melting furnace. Make grain mounts of your run products and identify the phases. We may also use the SEM to image and analyze your run products. • Phase diagram method: Calculate the normative composition of your rock and plot it on the Fo-An-Si diagram; predict the crystallization sequence. • Numerical method: Use the computer program MELTS to predict the crystallization sequence. Also explore differences in crystallized assemblages and evolution of liquid compositions between batch and fractional crystallization. • Use the chemical composition of the rock to classify it and to make up REE, tectonic discrimination and spider diagrams and interpret them.
Skill: Creating plots in Excel and Interpreting • What rock did your group work on? ______________________ • Use the Excel template NormCalc.xlt to calculate the normative mineralogy of your rock. What are the normative minerals in your rock, and their percentages? • Enter major element concentrations into cells C2:E2 on sheet “My Data” in the Excel template Alkalinity.xlt. Is your rock alkaline or subalkaline? What rock type is it classified as in the TAS (Total Alkalis vs. Silica) diagram? • For samples QLO-1 and GSP-2 only: Enter the normative composition of your rock into cells B17:D17 on sheet “Ternplot” in the Excel template TTGternaryplot.xlt. What is the classification of your rock? • Enter trace element concentrations into cells B3:B10 on sheet “My Data” in the Excel template Discrimination.xlt. Examine the various plots that are automatically produced on the other sheets. What conclusions can you draw about the tectonic environment that your rock formed in? • Replace the values in cells B2:B16 in the sheet “Normed REE data” in the template REEPlot.xlt with the REE concentrations in your rock in ppm. Describe the shape of the REE pattern. Is your rock enriched or depleted in the LREE? Explain why. Is there a Ce or Eu anomaly? Why or why not? • Replace the values in cells B2:B29 in the sheet “Normalized T.E. data” in the template SpiderPlot.xlt with the trace element concentrations in your rock in ppm. What are the characteristic features? What conclusions can you draw about the environment that your rock formed in?
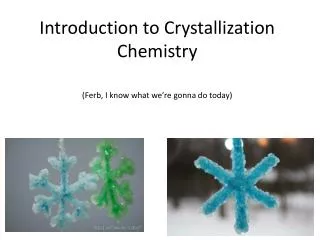
Skill: Performing Experiments • In this exercise you will grow your own volcanic rock! First read about Experimental Petrology at: http://serc.carleton.edu/research_education/equilibria/experimentalpetrology.html • Make a grain mount of your rock powder using immersion oil with an index of fraction of 1.54. • Use the optical microscope to identify the minerals in your rock. • Create your volcanic rock, powder it, make a grain mount, describe and interpret the textures, and identify the minerals. • List the minerals and their approximate percentages. • Are the minerals you identified consistent with the rock type?
Skill: Interpreting Phase Diagrams • Use the normative Fo (or En), An and Si contents to plot your rock composition on the Fo-An-Si diagram. • List the minerals in order of crystallization, and estimate the temperature at which they start to crystallize. Estimate the proportions of each phase in the rock when it solidifies.
Skill: Numerical Modeling • Read about MELTS at: http://serc.carleton.edu/research_education/equilibria/melts.html • Use Melts to identify the equilibrium phases and their compositions at the same conditions as your experiment. • Questions: • How do the proportions of each phase compare with those observed in your run products? Try to explain any discrepancies. • Explain the change in liquid viscosity with temperature (I believe this is just for liquid and not liquid + crystals). • Does the Harker diagram you made look like ones in your text that we discussed in class (e.g., Crater Lake) for series of cogenetic rocks? Explain.
Summary Questions • Compare the crystallization sequences predicted by the Numerical and Phase Diagram methods and observed using the Experimental Method. Try to explain any discrepancies. • How do you know the crystals in your run product grew during the experiment and were not retained from the starting material? How could you test this experimentally? • Which method is the most generally useful? Explain. • Which method is likely to be most accurate? Explain.
Other Options • Have students image and analyze phases in run products using SEM and EDS • Have students use X-ray diffraction to identify phases in run products


![[Insert exercise name]](https://cdn0.slideserve.com/1400721/insert-exercise-name-dt.jpg)