Download

1 / 29
290 likes | 323 Vues
Explore methods like Payback and Present-Worth analysis to evaluate business investments effectively in this chapter. Understand loan versus project cash flows, initial screening methods, and comparing mutually exclusive alternatives.

E N D
Chapter 5Present-Worth Analysis • Loan versus Project Cash Flows • Initial Project Screening Methods • Present-Worth Analysis • Methods to Compare Mutually Exclusive Alternatives
Chapter Opening Story – Federal Express Nature of Project: • Equip 40,000 couriers with Power Pads • Save 10 seconds per pickup stop • Investment cost: $150 million • Expected savings: $20 million per year Federal Express
Ultimate Questions • Is it worth investing $150 million to save $20 million per year, say over 10 years? • How long does it take to recover the initial investment? • What kind of interest rate should be used in evaluating business investment opportunities?
Loan Customer Bank Interest + Repayment Bank Loan vs. Investment Project • Bank Loan (loan cash flow) • Investment Project (project cash flow) Investment Project Company Return
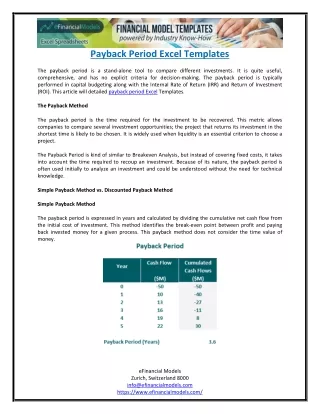
Initial Project Screening MethodPayback Method screens projects on the basis of how long it takes for net receipts to equal investment spending. • Principle: • How fast can I recover my initial investment? • Method: • Based on cumulative cash flow (or accounting profit) • Screening Guideline: • If the payback period is less than or equal to some specified payback period, the project would be considered for further analysis. • Weakness: • Does not consider the time value of money
Example 5.1 Conventional Payback Period with Salvage Value N Cash Flow Cum. Flow 0 1 2 3 4 5 6 -$85,000 -$50,000 -$5,000 $45,000 $95,000 $140,000 $175,000 -$105,000+$20,000 $35,000 $45,000 $50,000 $50,000 $45,000 $35,000 Payback period should occurs somewhere between N = 2 and N = 3.
$45,000 $45,000 $35,000 $35,000 $25,000 $15,000 Annual cash flow 0 1 2 3 4 5 6 Years $85,000 150,000 3.2 years Payback period 100,000 50,000 Cumulative cash flow ($) 0 -50,000 -100,000 0 1 2 4 5 6 3 Years (n)
Example 5.2 Discounted Payback Period Calculation Modify the procedure and consider time value of money, such as the cost of money (interest) used to support the project. * Cost of funds = (Unrecovered beginning balance) X (interest rate)
PW(i) > 0 Net Present Worth (NPW) Measure • Principle: Compute the equivalent net surplus at n = 0 for a given interest rate of i. • Decision Rule: Accept the project if the net surplus is positive. Inflow 0 1 2 3 4 5 Outflow Net surplus PW(i) inflow 0 PW(i) outflow
Example 5.3 - Tiger Machine Tool Company Net Present Worth – Uneven Flows inflow $55,760 $27,340 $24,400 0 3 1 2 outflow $75,000
Present Worth Amounts at Varying Interest Rates *Break even interest rate
Present Worth Profile 40 Reject Accept 30 20 Break even interest rate (or rate of return) 10 $3553 17.45% 0 PW (i) ($ thousands) -10 -20 -30 0 5 10 15 20 25 30 35 40 i = MARR (%)
Investment Pool Concept • Suppose the company has $75,000. It has two options. (1)Take the money out and invest it in the project or (2) leave the money in the company. • Let’s see what the consequences are for each option.
Meaning of Net Present Worth N = 3 How much would you have if the Investment is made? $24,400(F/P,15%,2) = $32,269 $27,340(F/P,15%,1) = $31,441 $55,760(F/P,15%,0) = $55,760 NFW of the project$119,470 How much would you have if the investment was not made? $75,000(F/P,15%,3) = $114,066 What is the net gain from the investment? $119,470 - $114,066 = $5,404 Investment pool $75,000 Return to investment pool $55,760 $27,340 $24,400 Project 0 1 2 3 PW(15%) = $5,404(P/F,15%,3) = $3,553
Project Balance Concept (Bank loan) N 0 1 2 3 Beginning Balance Interest Payment Project Balance -$75,000 -$11,250 +$24,400 -$61,850 -$61,850 -$9,278 +$27,340 -$43,788 -$43,788 -$6,568 +$55,760 +$5,404 -$75,000 -$75,000 Net future worth, FW(15%) PW(15%) = $5,404 (P/F, 15%, 3) = $3,553
Project Balance Diagram 60,000 40,000 20,000 0 -20,000 -40,000 -60,000 -80,000 -100,000 -120,000 Terminal project balance (net future worth, or project surplus) $5,404 Discounted payback period Project balance ($) -$43,788 -$61,850 -$75,000 0 1 2 3 Year (n)
Comparing Mutually Exclusive Projects • Mutually Exclusive Projects • When alternatives are mutually exclusive, any one if the alternatives will fulfill the • same need, and the selection of one alternative implies that the others will be • excluded. Example of buying versus leasing car. • Alternative vs. Project • When we use terms alternative and project interchangeably to mean decision • option. • Do-Nothing Alternative • When considering an investment, we are in one of two situations: Either the project • is aimed at replacing an existing asset or system, or it is a new attempt. • If a process or system already in place to accomplish our business objectives is • adequate, then we must determine which, if any, new proposals are economical • replacement. If none are feasible, then we do nothing. • If the existing system has failed, then the choice among proposed alternatives is • mandatory (i.e., do nothing is not an option).
Revenue Projects • are projects that generate revenues that depend on the choice of alternative that we want to select the alternative with the largest net gains • Service Projects • are projects that generate revenues that do not depend on the choice of project, but must produce the same amount of output (revenue) with lower production cost.
Analysis Period • is the time span over which the economic effects of an investment will be evaluated. • The study (analysis) period, sometimes called the planning horizon, is the • selected time period over which Mutually Exclusive alternatives are • compared. • Factors influence the decision are; the required service period, the useful life of the shorter lived alternative, the useful lived of the longer lived alternative, company policy and so on. • Consider Analysis period to be Required Service Period. • One convenient choice of analysis is the period of the useful life of the • investment project.
Comparing Mutually Exclusive Projects • Case 1:Project lives longer than the analysis period (Example 5.6) • Case 2: Project lives shorter than the analysis period (Example 5.7)
Case 1:Project lives longer than the analysis period (Example 5.6) • Estimate the salvage value at the end of • required service period. • Compute the PW for each project over • the required service period.
Example 5.6 - Comparison of unequal-lived service projects when the required service period is shorter than the individual project life Required Service Period = 2 years
PW(15%)B = -$364,000 PW(15%)A = -$362,000
Case 2:Project lives shorter than the analysis period (Example 5.7) • Come up with replacement projects that match or exceed the required service period. • Compute the PW for each project over the required service period.
Example 5.7 - Comparison for Service Projects with Unequal Lives when the required service period is longer than the individual project life $2,000 0 1 2 5 3 4 Model A $5,000 $5,500 Required Service Period = 5 years $6,000 $1,500 $12,500 2 3 1 0 4 5 Model B $4,000 $4,500 $5,000 $5,500 $15,000
PW(15%)A = -$35.929 PW(15%)B = -$33,173