The Inheritance of Complex Traits
330 likes | 588 Vues
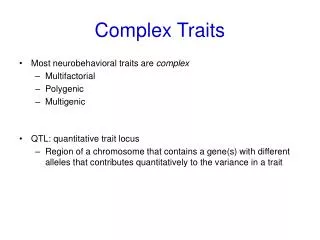
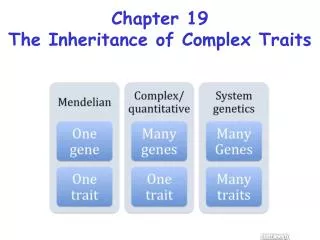
The Inheritance of Complex Traits. Chapter 5. 5.1 Polygenic Traits. Discontinuous variation Phenotypes that fall into two or more distinct, nonoverlapping classes or varieties Mendels ’ peas Continuous variation

The Inheritance of Complex Traits
E N D
Presentation Transcript
The Inheritance of Complex Traits Chapter 5
5.1 Polygenic Traits • Discontinuous variation • Phenotypes that fall into two or more distinct, nonoverlapping classes or varieties • Mendels’ peas • Continuous variation • A distribution of phenotypes from one extreme to another in an overlapping fashion (like height in tobacco plants and humans) • The phenotypes together represent a bell-shaped curve
Example of a Continuous phenotype Fig. 5-2, p. 96
Polygenic Inheritance • The distribution of polygenic traits through the population follows a bell-shaped (normal) curve
Types of Traits • Polygenic traits • Traits controlled by two or more genes • Multifactorial traits • Polygenic traits resulting from interactions of two or more genes and one or more environmental factors
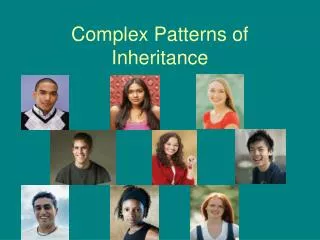
Polygenic Inheritance • Two or more genes contribute to the phenotype • Phenotypic expression varies across a wide range so a large population must be analyzed when studying a trait • Interactions with the environment often participate in creating the phenotype. • Height, weight, skin color, eye color, and intelligence
5.3 The Additive Model of Polygenic Inheritance • The number of phenotypic classes increases as the number of genes controlling a trait increases
Regression to the Mean • Averaging out the phenotype is called regression to the mean • In a polygenic system, parents who have extreme differences in phenotype tend to have offspring that exhibit a phenotype that is the average of the two parental phenotypes
A Polygenic Trait: Eye Color • Five basic eye colors fit a model with two genes, each with two alleles Fig. 5-6, p. 99
The Threshold Model • Explains the discontinuous distribution of some multifactorialtraits (clubfoot, cleft lip, congenital hip dislocation in females, pyloric stenosis in males)
5.5 Heritability Measures the Genetic Contribution to Phenotypic Variation • Phenotypic variation is derived from two sources: • Genetic variance • The phenotypic variance of a trait in a population that is attributed to genotypic differences • Environmental variance • The phenotypic variance of a trait in a population that is attributed to differences in the environment
Heritability of a Trait Heritability The proportion of a phenotype that is dependent upon genotype. Measuring heritability involves study of twins and adopted children.
Heritability Estimates • Heritability is estimated by observing the amount of variation among relatives who have a known fraction of genes in common (known as genetic relatedness) • Heritability can be estimated only for the population under study and the environmental condition in effect at the time of the study
Correlation • Correlation coefficient • The fraction of genes shared by two relatives • Identical twins have 100% of their genes in common (correlation coefficient = 1.0) • When raised in separate environments identical twins provide an estimate of the degree of environmental influence on gene expression
5.6 Twin Studies and Multifactorial Traits • Monozygotic (MZ) • Genetically identical twins derived from a single fertilization involving one egg and one sperm • Dizygotic (DZ) • Twins derived from two separate and nearly simultaneous fertilizations, each involving one egg and one sperm • DZ twins share about 50% of their genes
Concordance • Agreement between traits exhibited by both twins • In twin studies, the degree of concordance for a trait is compared in MZ and DZ twins reared together or apart • The greater the difference, the greater the heritability
Concordance, Heritability, and Obesity • Concordance can be converted to heritability by statistical methods • Twin studies of obesity show a strong heritability component (about 70%) Table 5-3, p. 106
Genetic Clues to Obesity: The ob Gene • The ob gene encodes the weight-controlling hormone leptin in mice; receptors in the hypothalamus are controlled by the dbgene • The ob gene encodes the hormone Leptin • produced by fat cells that signals the brain and ovary • As fat levels become depleted, secretion of leptin slows and eventually stops Fig. 5-13, p. 108
Human Obesity Genes • In humans, mutations in the gene for Leptin (LP) of the Leptin receptor (LEPR) account for about 5% of all cases of obesity; other factors cause the recent explosive increase in obesity
5.7 More on the Genetics of Height • The development of new technologies allows researchers to survey the genome to detect associations with phenotypes such as height, weight, etc. • The use of single nucleotide polymorphisms (SNPs) allows the association between haplotypes and phenotypes. • Haplotype: specific combinations of SNPs located close to gather on a chromosome that are very likely inherited as a group.
DNA source SNP SNP SNP SNP Reference standard Original haplotype 10,000 nucleotides Person 1 Haplotype 1 Person 2 Haplotype 2 Person 3 Haplotype 3 Person 4 Haplotype 4 Fig. 5-16, p. 110
5.8 Skin Color and IQ are Complex Traits • Skin color is a polygenic trait • It is controlled by 3 or 4 genes, plus environmental factors (most obvious—sun exposure) • Can intelligence be measured quantitatively? • Psychological measurements and the ability to perform specific tasks at a specific age led to the development of the intelligent quotient (IQ) test. • There is no evidence that intelligence can be measured objectively (like height or weight) • Interestingly, IQ measurements do have a significant heritable components
Are Intelligence and IQ Related? • Can intelligence be measured quantitatively? • Early studies believed that physical dimensions of regions of the brain were a measure of intelligence. Fig. 5-19, p. 112
More meaningful measures of intelligence and the search for genes that control intelligence • IQ test scores can’t be equated with intelligence • Relative contributions of genetics, environment, social and cultural influences can’t be measured • General cognitive ability • Characteristics include verbal and spatial abilities, memory and speed of perception, and reasoning • Genes associated with reading disability (dyslexia) and cognitive ability have been discovered by comparing haplotypes • Both genetic and environmental factors make important contributions to intelligence
Correlation coefficients of IQ measurements Expected value Pairs studied Nonbiological sibling pairs (adopted/natural pairings) (5) 0.0 Nonbiological sibling pairs (adopted/adopted pairings) (6) 0.0 Foster-parent child (12) 0.0 Single-parent offspring reared together (32) 0.5 (4) Single-parent offspring reared apart 0.5 (2) Siblings reared apart 0.5 Siblings reared together (69) 0.5 Dizygotic twins, opposite sex (18) 0.5 (29) Dizygotic twins, same sex 0.5 (3) Monozygotic twins reared apart 1.0 Monozygotic twins reared together (34) 1.0 0 0.1 0.2 0.3 0.4 0.5 0.6 0.7 0.8 0.9 1.0 Correlation coefficient Fig. 5-20, p. 113