Download
1 / 54
540 likes | 707 Vues
Chapter 10 International Trade I --- The Law of Comparative Advantage. Contents:. The law of comparative advantage Distribution of gains from trade Graphical illustration of international trade International trade – Reasons and hindrance

E N D
Chapter 10 International Trade I --- The Law of Comparative Advantage
Contents: • The law of comparative advantage • Distribution of gains from trade • Graphical illustration of international trade • International trade – Reasons and hindrance • Advanced Materials 10.1 : Graphical illustration of international trade – Increasing production cost
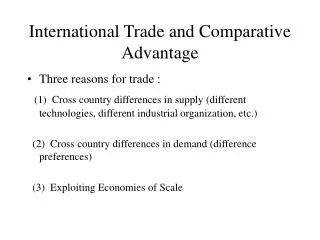
Necessary conditions for international trade • Factors of production cannot be moved across national boundaries but goods can. Why? • Production costs of the trading parties are different. Why? • The transportation and the transaction costs involved do not exhaust the gains from trade. Why? • Protectionist measures are not prohibitive. Why?
Absolute advantage • A country is said to have an absolute advantage over another country in the production of a good if it can produce a larger amount of the good than the other country with the same amount of resources.
Reciprocal absolute advantage • Two countries are said to have • a reciprocal absolute advantage over each • other if each country has an absolute advantage • over the other in producing one of the two goods.
The principle • Given that two countries have a reciprocal absolute advantage over each other, if each specializes in producing the good in which it has an absolute advantage, then the world’s total output will increase.
Clothing Case I Food *1 unit of resources (a combination of labour, capital, and land) • Which country has an absolute advantage in the production of food? Country A • Which country has an absolute advantage in the production of clothing? Country B
Specialization leads to increase in world’s output • If nowcountry A shifts 1 unit of resources from the production of clothingto the production of food. • And country B shifts 1 unit of resources from the production of food to the production of clothing. Food Clothing +10 -8 -3 +10 +7 +2
Case II Food Clothing *1 unit of resources ( a combination of labour, capital, and land) • Which country has an absolute advantage in the production of food? Country A • Which country has an absolute advantage in the production of clothing? Country A
Comparative advantage • A country is said to have a comparative advantage over another country in the production of a good if itcan produce the good at a lower opportunity cost than the other country.
The law of comparative advantage • The law of comparative advantage or • the law of comparative cost states that • if each country specializes in the production • of the good in which it has a comparative adv. • (or a lower production cost), • the world’s total output will increase.
Specialization leads to an increase in world’s output • If country A produces one more unit of food • whilecountry B produces one more unit of clothing Clothing Food
Absolute advantage versus comparative advantage 1. Abs. adv. and comp. adv. are unrelated. • Abs. adv. compares productivity of the two countries (the amount of output obtained per unit of resources). • Comp. adv. compares production costs of the two countries (the amount of another good forgone per unit of output). • However, if two countries have a reciprocal absolute advantage over each other, each will have a comparative advantage in the production of the good that it has an absolute advantage.
2. It is possible for a country to have an absolute advantage in the production of all goods, but it is impossible for the country to have a comparative advantage in all production. 3. It is the comparative advantage (not the absolute advantage) that determines the allocation of resources and the direction of trade. • However,comparative advantagedoes not determinethe volume of trade, theterms of tradeorthe balance of trade.
Q10.4: For each of the following typical cases, determine (a) which country has an absolute advantage in the production of (i) food(ii) clothing (b) which country has a comparative advantage in the production of (i) food(ii) clothing
Calculation of production costs • Given the amount of good X and good Y produced per unit of resources (marginal products), i.e., MPX and MPY: Production cost of 1X is Production cost of 1Y is
Calculation of production costs 2. Given the amount of resources required to produce one unit of good X and good Y (real marginal costs in terms of resources), i.e., MCX and MCY: Production cost of 1X is Production cost of 1Y is
Calculation of production costs 3. Given the amount of money required to produce one unit of good X and good Y (nominal marginal costs in terms of money), i.e., MCX and MCY: Production cost of 1X is Production cost of 1Y is
Principle • Specialization raises the world’s total output, while trade distributes the output among trading parties. • The world price (or exchange ratio or terms of trade) of a good is determined by its D & S in the world market. • From the trading of a good, a country gains the difference between its production cost of the good and the good’s world price.
Illustration Amount of labour required to produce a unit of food and clothing in country A and country B Food Clothing
Calculation of gains from trade Given exchange ratio: 1F=1C • World price of 1F (=1C) > Country A’s production cost of 1F (=0.8C) Country A exports food • From each unit of food exported, country A gains 0.2C (=1C-0.8C).
Calculation of gains from trade Given exchange ratio: 1F=1C • World price of 1F (=1C) < Country B’s production cost of 1F (=3.33C) Country B imports food • From each unit of food imported, country B gains 2.33C (=3.33C-1C).
TOT= Terms of trade • Terms of trade (TOT) is the ratio of a country’s export price (PX) to its import price (PM).
Implications of the terms of trade • TOT • It measures the amount of import that a country can exchange with a unit of its export • Animprovement (or deterioration) in the terms of trade reflects an increase (decrease) in the gain from trade per unit of export. • A change in the terms of trade has no implicationon theamount of trade, the total gain from trade orthe balance of trade. Why?
Terms of trade index The terms of trade index =the unit value indexfor total exports the unit value index for imports measured in the same base period • The unit value indexfor total exports(or imports) • is the weighted average of the export prices (or the import prices). • where the weight of a good is equal to the proportion of its value in the total value of exports (or the total value of imports).
Q10.6 How will the terms of trade of Hong Kong be affected under the following situations? (a) A rise in the price of foodstuff imported from the mainland. (b) An improvement in the labour productivity in Hong Kong. (c) A rise in the exchange value of Japanese yen.
A. Illustration with two separate diagrams – constant production cost • Given information: • Production possibility curves of countries A & B • Indifference maps of countries A & B • A price line with its slope representing the world price (or the exchange ratio or the terms of trade) of good X in terms of good Y
1. The situation without trade (the autarkic situation) - Without trade, a country is self-sufficient. It can consume what it can produce only, i.e., its production possibility curve (PPC) = its consumption possibility curve (CPC). - To maximize social welfare, the country’s consumption optimum (CO) is the tangency point of its PPC and the highest indifference curve achievable, which is also its production optimum (PO) under self-sufficiency.
1F 1 600 Slope = Cost of 1F = 1 600C/2 000 = 0.8C COA0 POA0 2 000 Country A: The situation without trade Clothing PPCA0 = CPCA0 Food 0
1F 1 500 Slope = Cost of 1F = 1 500C/450 = 3.33C COB0 POB0 450 Country B Clothing PPCB0 = CPCB0 0 Food
2. The situation with trade • From the PPCs, the amount of output of the two countries can be compared. However, without information on their amount of resources endowed, absolute advantage cannot be determined. • The slope of a PPC shows the marginal production cost of good X in terms of good Y. On the other hand, its inverse shows the marginal production cost of good Y in terms of good X. • As PPCA has a gentler slope than PPCB, country A has a lower cost in producing good X (food) while country B has a comparative advantage in producing good Y (clothing).
The world price is determined by demand & supply at which Qd of the importing country equals Qs of the exporting country. • With the existence of international market, a country can sell what it produces to buy what it wants to consume. This can be represented by a movement along the price line passing through the PO. • To maximize wealth, the new PO is the point through which the outermost price line passes. • The outermost price line is the new CPC. • To maximize social welfare, the CO is the point at which the new CPC touches the highest indifference curve achievable.
Complete specialization POA Country A Clothing ---- Possible consumption possibility curves 2 000 ---- Outermost consumption possibility curve 1 600 PPCA Food 0 2 000
Complete specialization POB Country B Clothing 1 500 ---- Possible consumption possibility curves PPCB ---- Outermost consumption possibility curve 0 Food 450 1 500
Amount of trade • If PO > CO, the excess amount of the good is exported. On the other hand, if PO < CO, the insufficient amount is imported. • Country A’s export is country B’s import and vice versa.
CPCA COA 1 000 Import POA Export 1 000 Graphical illustration Clothing Country A 2 000 1 600 PPCA Food 0 2 000
POB Export COB 500 Import CPCB 1 000 Graphical illustration Clothing Country B 1 500 PPCB 0 Food 450 1 500
COA=COB 0 PPCB 1 000 POA=POB C 1 000 F Illustration with a composite diagram – Constant production cost F: Export of country A = Import of country B = 1 000 units of food Countries A & B Clothing 2 000 C: Export of country B = Import of country A = 1 000 units of clothing 1 600 PPCA 2 000 0 Food
Advanced Material 10.1 Graphical Illustration of International Trade – Increasing Production Cost
COA0 COB0 MCB0 POA0 POB0 MCA0 By production possibility curve and indifference curve Without trade (the autarkic situation) Clothing Clothing Country A Country B
COA1 Import of country A POA1 Export of country A With trade Clothing Country A ICA1 > ICA0
POB1 Export of country B COB1 Import of country B Clothing Country B ICB1> ICB0
Reasons for international trade 1. Incapable of being self-sufficient 2. Difference in production costs 3. Economies of scale and learning by doing 4. A wider range of goods and services 5. Improvement in technology and productivity 6. Suppression of domestic monopoly 7. Price stability 8. Intangible benefits