Download
1 / 14
140 likes | 306 Vues
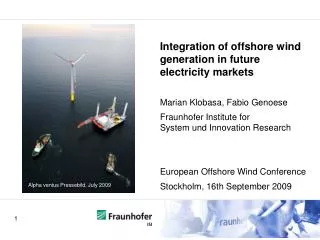
Integration of offshore wind generation in future electricity market s Marian Klobasa, Fabio Genoese Fraunhofer Institute for System und Innovation Research European Offshore Wind Conference Stockholm, 16th September 2009. Alpha ventus Pressebild, July 2009. Agenda.

E N D
Integration of offshore wind generation in future electricity markets Marian Klobasa, Fabio Genoese Fraunhofer Institute for System und Innovation Research European Offshore Wind Conference Stockholm, 16th September 2009 Alpha ventus Pressebild, July 2009
Agenda • Characteristic of wind power generation in the North Sea • Fullload hours, periods with high and low wind generation • Methodological approach to analyse impacts on electricity markets • Future spot market prices affected by offshore generation • Influence of grid infrastructure and restrictions • Conclusion
Main assumptions for wind time series generation • Wind speed data • Time series generated from weather data (provided by DWD, 180 locations) • Distribution of installed onshore capacity according to DENA study • Adoption of improved power curves and increased hub heights makes it necessary to use wind speed data (data used from 1998, 2000 and 2001) • Power curves for wind turbines • Offshore: Enercon E 126, REPower 5M, Vestas V90 Offshore • Onshore: Enercon E66, E70, E82, E112, REPower 5M • Diffusion of modern turbine types • Increase of typical hub height from 65 m to around 80 m (limited by building-authority approval)
Wind energy generation pattern in winter time Installed capacity in GW North Sea: 25,1 Onshore: 18,5 North-West: 8,5 Week 1 Week 2 Week 3 Week 4 Week 5 Week 6 Week 7 Week 8
Wind energy generation pattern in summer time Installed capacity in GW North Sea: 25,1 Onshore: 18,5 North-West: 8,5 Week 1 Week 2 Week 3 Week 4 Week 5 Week 6 Week 7 Week 8
Fullload hours of wind power generation Increase of full load hours due to technology improvement, increased hub heights and offshore installations
Simulation of electricity markets with PowerACE • Agent-based power market model • Hourly time resolution • Actors in the electricity sector are simulated as agents • Main module: PowerACE Spot Market • Hourly auctions • Uniform clearing price auction • Resembles EEX • Bidding process • Variable costs • Strategic costs • Focus on the German market
Main assumptions for future electricity system • Scenario assumptions: • Energy carrier prices: [WEO 2008] • Electricity demand: [EWI/Prognos 2005] • RES-E targets: 45% until 2030 • Emission reduction target: -37% until 2030 • Electricity generation mix: • Increasing share of gas-fired power plants • Decreasing share of lignite-fired and coal-fired power plants • Nuclear phase-out in 2020
Impacts of wind generation on electricity prices Price Development & Emissions • Average electricity price („base“) increases with years due to increasing fuel prices. • Peak[1] price is rising slightly faster than the off-peak[2] price which leads to an increasing spread between peak and off-peak. • [1]: peak: 8-20 (week days) • [2]: off-peak: 20-8 (week days) + weekends 100%: Base 2010 • The moderate emission reduction targets are achieved both by an increasing share of renewables to the generation mix and a fuel switch to gas which is favored by the moderate gas price. • The specific emissions reach a value of roughly 330 g/kWh in 2030 (2008: 580 g/kWh).
Impacts of wind generation on electricity prices Typical Price Variations 2030 2010 • The graphs show the price variation around the average price of the corresponding year. • 2010: • relatively low share of renewables: renewable load never exceeds system load • price variation: mostly around ±50% • 2030: • higher contribution of renewables: renewable load exceeds system load in some hours • more frequent variations
Influences of grid infrastructure and restrictions • Heavy influence expected in NW part of Germany (→ connection of North Sea wind parks) • Market simulation with two zones, limited transmission capacity between the zones • Definition of the zones similar to the Dena grid study • North-Western Zone (Dena: 2) • Residual Germany (Dena: 1,3,4,5,6) • Export capacity of NW zone: ~12 GW DK 2260 MVA S 600 MVA Zone NW Load, Renewables, Thermal Generation NL 2626 MVA Hannover 3160 MVA Münster 987 MVA Bielefeld 3448 MVA
Impacts of grid restrictions on electricity prices GridRestrictions: NW Zone NoGridRestrictions 100%: AVG 2010
Conclusions • Offshore wind generation • 3800 fullload hours can be achieved in the North Sea, fullload hours of total wind generation increase from less than 2000 h to almost 3000 h • In winter time longer periods of several days with high wind feed-in. In summer time limited wind feed-in, but periods with high feed-in from offshore locations can occur. • Simulation of German spot market: • high share of renewables, moderate increase of energy carrier prices, increasing share of gas-fired power plants, moderate CO2-prices • Increasing spot market price and increasing price spread between peak and off-peak time • Negative residual demand in 2020 and 2030 • ~ 100 hours without considering grid restrictions in Germany • ~ 2700 hours when considering grid restrictions in Germany • Grid restrictions in North-West Germany • Strong need for grid extensions up to 10 GW out of North-Western Zone • Value of wind feed-in is limited in the North-Western Zone without grid extensions • Further need for political support mechanism for offshore development • Average market prices could be to low to secure investment in offshore locations • Furthermore value of wind is below average market price due to the merit-order effect
Contact and further information Dr. Marian Klobasa Fraunhofer Institute for Systems and Innovation Research, KarlsruheContact: M.Klobasa@isi.fraunhofer.de www.isi.fraunhofer.de www.wind-last.de