Download

1 / 11
110 likes | 267 Vues
Chapter 3 Measures of Central Tendency. The Mode. The mode is the most frequently occurring value in a distribution. Abbreviated as Mo Sometimes there is more than one mode Ex: 96, 91, 96, 90, 93, 90, 96, 90

E N D
Chapter 3 Measures of Central Tendency
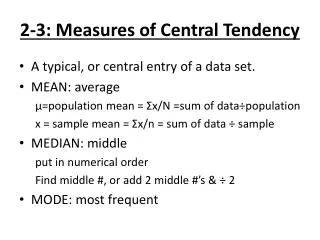
The Mode • The mode is the most frequently occurring value in a distribution. • Abbreviated as Mo • Sometimes there is more than one mode • Ex: 96, 91, 96, 90, 93, 90, 96, 90 • Mode is the only measure of central tendency appropriate for nominal-level variables
Mode - Example • What is the mode for the following set of numbers? • 20, 21, 30, 20, 22, 20 • Explains nothing about • Ordering of variables • Variation within variables • Distributions can be bimodal and/or multimodal • Several categories with same frequencies
Position of the Mdn The Median • The median is the middle case of a distribution • Abbreviated as Mdn • Appropriate for ordinal data because it only shows direction and not distance • Used if distribution is skewed • How to find the median? • If even, there will be two middle cases – interpolate • If odd, choose the middle-most case • Cases must be ordered • 1, 5, 2, 9, 13, 11, 4 • 1, 2, 2, 6, 4, 1, 4, 3
The Mean The mean is appropriate for interval and ratio level variables X = raw scores in a set of scores N = total number of scores in a set • 4.6, 7.9, 11.4, 2.2
An Illustration: Measures of Central Tendency in a Skewed Distribution • Mean = $50,000 • Median = $40,000 • Mode = $30,000
Illustration • Suppose we’re interested in finding out the number of evenings freshmen are drinking each month. Using the first ten responses from a survey, we find the following responses: • 2, 5, 0, 3, 11, 1, 3, 1, 1, 2 • What is the mode, median, and mean?
Comparing the Mode, Median, and Mean Three factors in choosing a measure of central tendency • Level of measurement • Shape or form of the distribution of data • Skewness • Kurtosis • Research Objective
Summary • Three best known measure of central tendency – mode, median, mean • Three factors determine appropriateness • Level of measurement • Shape of the distribution • Research objective