Measures of Central Tendency
160 likes | 322 Vues
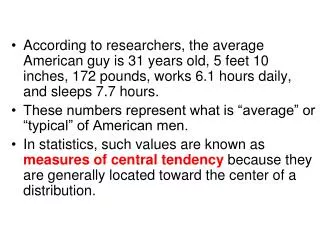
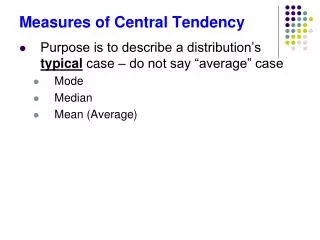
This comprehensive overview explores the measures of central tendency—mode, median, and mean—along with their applications in understanding data distributions. Learn how skewness affects data representation, the significance of standard deviation in evaluating variability, and the differences between criterion-referenced and norm-referenced tests. The explanations delve into score interpretation, percentile ranks, advantages and disadvantages of each testing type, and the critical aspects of reliability and validity in measurement. Ideal for students and educators alike.

Measures of Central Tendency
E N D
Presentation Transcript
Measures of Central Tendency Peter Swanson, PhD Georgia State University
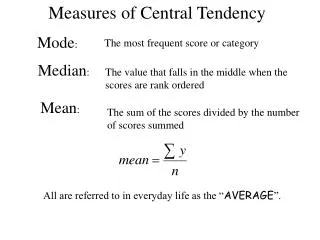
Mode 14 16 16 17 18 19 19 19 21 22 Median 14 15 16 17 18 19 20 21 22 Mean 1 2 3 4 5 6 7 Range
Measures of Variability • 24, 24, 25, 25, 25, 26, 26 x̄= 175/7 = 25 • 16, 19, 22, 25, 28, 30, 35 x̄= 175/7 = 25 • is more homogeneous that those in (b).
Why care about the Standard Deviation? A low standard deviation indicates that all of the data points are very close to the same value (the mean). A high standard deviation indicates that the data are “spread out” over a large range of values.
Percentile Rank A score equals the percentage of scores in its frequency distribution which are lower or equal to it.
Criterion-referenced tests • Many criterion-referenced tests involve a cutscore, where students pass if their score exceeds the cutscore and fails if it does not (often called a mastery test). • The criterion-referenced interpretation of a test score identifies the relationship to the subject matter. • A criterion-referenced test will use questions which were correctly answered by students who know the specific material.
Norm-referenced tests • Yield an estimate of the position of the tested individual in a predefined population, with respect to the trait being measured. • Indicate whether the test-taker did better or worse than other people who took the test. • Report primarily whether a student correctly answered more questions compared to other students in the group. • Use questions which were correctly answered by the "best" students and not correctly answered by the "worst" students.
Advantages / Disadvantages • NRT cannot measure progress of the population of a whole, only where individuals fall within the whole. • The difficulty level of items themselves, as are the cut-scores to determine passing levels are also changed from year to year. • NRT have been criticized for bias against minorities. • High Stakes testing- No Child Left Behinddefines failure if a school does not show improvement from year to year, even if the school is already successful.
Reliability and Validity Reliability – the consistency of measurement Validity – Measuring what you purport to measure.