Download
1 / 40
400 likes | 508 Vues
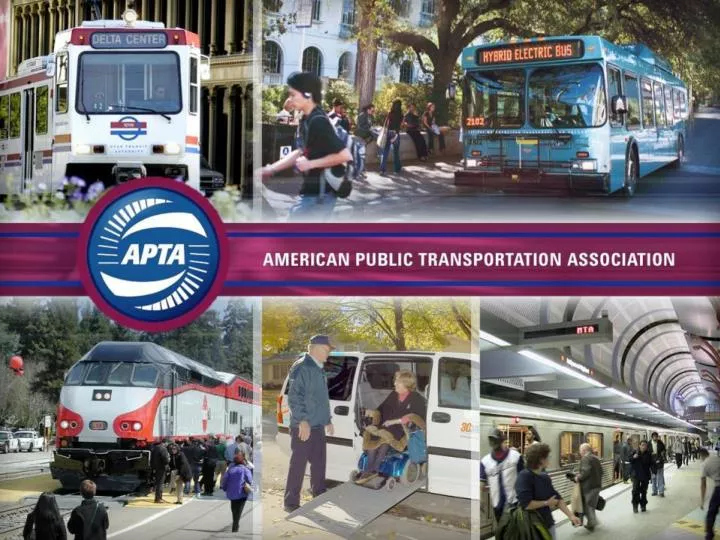
Art Guzzetti Vice President - Policy American Public Transportation Association August 7, 2008. Public Transportation & State/Local Finance. Who Are We?. APTA is: Trade association that represents and supports more than 1,500 members worldwide Headquartered in Washington, D.C.

E N D
Art Guzzetti Vice President - Policy American Public Transportation Association August 7, 2008 Public Transportation & State/Local Finance
Who Are We? APTA is: • Trade association that represents and supports more than 1,500 members worldwide • Headquartered in Washington, D.C. • An organization with roots beginning in 1882, the era of horse-drawn street railway cars
Presentation Overview • Snapshot on National Trends in Public Transportation • Why Invest in Public Transportation • Public Transportation Financing Strategies
What is Public Transportation? • Buses, heavy rail, commuter rail, light rail, streetcars, ferryboats, paratransit, vanpools • Scale of operations • Large Urban (Rail, Bus, Paratransit) • Small to Medium Urban (Bus, streetcars, light rail) • Rural (Demand response, limited fixed-route service) • Typically local/regional delivery with local, state and federal funds
Public Transportation in the U.S. 10.3 billion annual boardings in 2007; highest in 50 years 34 million times every weekday, people board public transportation Approximately 6,500 transit providers in U.S., but 70% of usage on top 30 systems 14
Transit Use Growing Faster Than Highway Use (1995 – 2007) (14%) (32%) (24%) 15
Public Transportation Ridership by Mode Transit Passenger Miles UnlinkedTransit Trips 16
Value of Public Transportation Investment • Offers choice and saves money • Transit availability can reduce need for additional car – annual savings of $8,000+ • Boosts the economy • $6 in benefit for every $1 invested • Access to employees, supports economic growth • Reduces congestion • Saves 541 million hours in travel delays (TTI) • Provides critical mobility • Seniors, persons with disability, those without an automobile • Rural transit - 48% seniors or persons with disabilities 18
Key to Urban Economic Growth and Mobility • New York – 53% • Baltimore – 20% • Boston – 32% • Chicago – 24% • Philadelphia – 27% • Madison – 11% • Pittsburgh – 19% • Seattle - 15% • Minneapolis – 13% • St. Louis – 14% • Washington, DC – 34% • Milwaukee – 10% • Public Transportation Commute Share 19
Transit Decreases Dependence on Foreign Fuel; Conserves Energy Oil Consumption Drops • Households near public transit drive an average of 4,400 fewer miles annually • Saves 4.2 billion gallons of gasoline annually • Reduces CO2 emissions by 37 million metric tons annually 20
Challenges Facing Public Transportation Higher energy prices Increased operating cost Increased demand for service Meeting demand for service Population/employment growth (420 million people by 2050) Aging population – 20% aged 65+ by 2025 Increasing congestion and fuel costs generate demand 21
Challenges Facing Public Transportation Transit security Protecting our existing assets Funding needs Shortfall of operating revenues Annual capital needs $60 billion (currently spend ~$13 billion) 22
Sources of Transit Funding • Federal • State • Local • Directly Generated • Fares • Agency taxes • Other (parking, advertising, etc.) 23
2006 Industry Revenue Sources – $47 Billion 2006 Capital Funding - $13.3 Billion 2006 Operating Funds- $33.7 Billion 24
Sources of Transit Agency Operating Expenses Wisconsin Operating Funding Sources U.S. Transit Operating Funding Sources 25
Potential Sources of State/Local Funding Assistance Sales Property Motor Fuel Vehicle Fees Car Rental Room/Occupancy Impact Fees Realty Transfer • Assessment Districts • Parking Fees/Taxes • Tolls • Employer/ Payroll/ Earnings/ Personal Income • Corporate Income • Utility Fees • Corporate Franchise Taxes 27
Sources of State Dedicated Tax Revenue for Operating (U.S Total) 28
Sources of Local Dedicated Tax Revenue for Operating (U.S. Total) 29
Local/State Dedicated Funding Sources • Minneapolis Metro Transit • Operating - State Sales Tax 38.1% • Operating - Directly Generated Property Tax 4.8% • Cincinnati SORTA • Capital - Local Income Tax 26.6% • Operating - Local Income Tax 49.4% • Operating - State Gasoline Tax 1.2% • Kansas City ATA • Capital - Local Sales Tax 18.0% • Operating - Local Sales Tax 58.8% 33
Local/State Dedicated Funding Sources • Des Moines MTA • Operating - State Other Tax 5.1% • Springfield IL MTD • Capital - Local Property Tax 9.1% • Capital - State Sales Tax 17.7% • Operating - Local Property Tax 25.7% • Operating - State Sales Tax 55.0% • Champaign-Urbana MTD • Operating - Local Property Tax 20.9% • Operating - State Other Tax 0.9% • Bloomington IN PTC • Operating - Local Income Tax 5.6% • Operating - Local Property Tax 17.8% • Operating - Local Other Tax 1.4% • Operating - State Gasoline Tax 1.2% 34