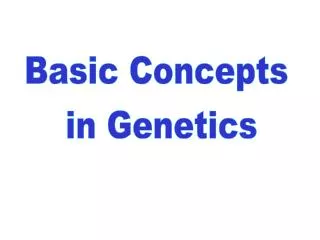
Introduction to some basic concepts in quantitative genetics
Introduction to some basic concepts in quantitative genetics. Harald H.H. Göring. Course “Study Design and Data Analysis for Genetic Studies”, Universidad ded Zulia, Maracaibo, Venezuela, 6 April 2005. trait. genes. environment. infections, accidental injuries. “mendelian” traits.

Introduction to some basic concepts in quantitative genetics
E N D
Presentation Transcript
Introduction to some basic conceptsin quantitative genetics Harald H.H. Göring Course “Study Design and Data Analysis for Genetic Studies”, Universidad ded Zulia, Maracaibo, Venezuela, 6 April 2005
trait genes environment infections, accidental injuries “mendelian” traits “complex” traits “Nature vs. nurture” 0% environmental contribution 100% 100% genetic contribution 0%
“Marker” loci • There are many different types of polymorphisms, e.g.: • single nucleotide polymorphism (SNP): • AAACATAGACCGGTT • AAACATAGCCCGGTT • microsatellite/variable number of tandem repeat (VNTR): • AAACATAGCACACA----CCGGTT • AAACATAGCACACACACCGGTT • insertion/deletion (indel): • AAACATAGACCACCGGTT • AAACATAG--------CCGGTT • restriction fragment length polymorphism (RFLP) • …
Genetic variation in numbers There are ~6 x 10⁹ humans on earth, and thus ~12 x 109 copies of each autosomal chromosome. Assuming a mutation rate of ~1 x 10⁸, every single nucleotide will be mutated (~12 x 109) / (~1 x 10⁸) = ~120 in each new generation of earthlings. Thus, every nucleotide will be polymorphic in Homo sapiens, except for those where variation is incompatible with life. Any 2 chromosomes differ from each other every ~1,000 bp. The 2 chromosomal sets inherited from the mother and the father (each with a length of 3 x 10⁹ bp) therefore differ from each other at ~3 x 10⁹ / ~1,000 = ~ 3 x 10⁶, or ~3 million, locations.
Definitions of some important terms locus: a position in the DNA sequence, defined relative to others; in different contexts, this might mean a specific polymorphism or a very large region of DNA sequence in which a gene might be located gene: the sum total of the DNA sequence in a given region related to transcription of a given RNA, including introns, exons, and regulatory regions polymorphism: the existence of 2 or more variants of some locus allele the variant forms of either a gene or a polymorphism neutral allele: any allele which has no effect on reproductive fitness; a neutral allele could affect a phenotype, as long as the phenotype itself has no effect on fitness silent allele: any allele which has no effect on the phenotype under study; a silent allele can affect other phenotype(s) and reproductive fitness disease-predisposing allele: any allele which increases susceptibility to a given disease; this should not be called a mutation mutation: the process by which the DNA sequence is altered, resulting in a different allele
Genetics vs. epidemiology:aggregate effects • The sharing of environmental factors among related (as well as unrelated) individuals is hard to quantify as an aggregate. • In contrast, the sharing of genetic factors among related (as well as unrelated) individuals is easy to quantify, because inheritance of genetic material follows very simple rules. • Aggregate sharing of genetic material can therefore be predicted fairly accurately w/o measurements: e.g. • a parent and his/her child share exactly 50% of their genetic material (autosomal DNA) • siblings share on average 50% of their genetic material • a grandparent and his/her grandchild (or half-sibs or avuncular individuals) share on average 25% of their genetic material • genome as aggregate “exposure”: While it is not clear whether an individual has been “exposed” to good or bad factors, “co-exposure” among relatives is predictable.
Use of genetic similarity of relatives • The genetic similarity of relatives, a result of inheritance of copies of the same DNA from a common ancestor, is the basis for • heritability analysis • segregation analysis • linkage analysis • linkage disequilibrium analysis • relationship inference • between close relatives (e.g., identification of human remains, paternity disputes) • between distant groups of individuals from the same species (e.g., analysis of migration pattern) • between different species (e.g., analysis of phylogenetic trees) • identification of conserved DNA sequences through sequence alignment • …
Relatives are not i.i.d. • Unlike many random variables in many areas of statistics, the phenotypes and genotypes of related individuals are not independent and identically distributed (i.i.d.). • Many standard statistical tests can and/or should therefore not be applied in the analysis of relatives. • Most analyses on related individuals use likelihood-based statistical approaches, due to the modeling flexibility of this very general statistical framework.
“Mendelian” vs. “complex” traits • “simple mendelian” disease • genotypes of a single locus cause disease • often little genetic (locus) heterogeneity (sometimes even little allelic heterogeneity); little interaction between genotypes at different genes • often hardly any environmental effects • often low prevalence • often early onset • often clear mode of inheritance • “good” pedigrees for gene mapping can often be found • often straightforward to map • “complex multifactorial” disease • genotypes of a single locus merely increase risk of disease • genotypes of many different genes (and various environmental factors) jointly and often interactively determine the disease status • important environmental factors • often high prevalence • often late onset • no clear mode of inheritance • not easy to find “good” pedigrees for gene mapping • difficult to map
Genetic heterogeneity locus homogeneity, allelic homogeneity time locus homogeneity, allelic heterogeneity locus heterogeneity, allelic homogeneity (at each locus) time locus heterogeneity, allelic heterogeneity (at each locus)
Study design different traits different study designs different analytical methods
How to simplify the etiological architecture? • choose tractable trait • Are there sub-phenotypes within trait? • age of onset • severity • combination of symptoms (syndrome) • “endophenotype” or “biomarker ” vs. disease • quantitative vs. qualitative (discrete) • Dichotomizing quantitative phenotypes leads to loss of information. • simple/cheap measurement vs. uncertain/expensive diagnosis • not as clinically relevant, but with simpler etiology • given trait, choose appropriate study design/ascertainment protocol • study population • genetic heterogeneity • environmental heterogeneity • “random” ascertainment vs. ascertainment based on phenotype of interest • single or multiple probands • concordant or discordant probands • pedigrees with apparent “mendelian” inheritance? • inbred pedigrees? • data structures • singletons, small pedigrees, large pedigrees • account for/stratify by known genetic and environmental risk factors
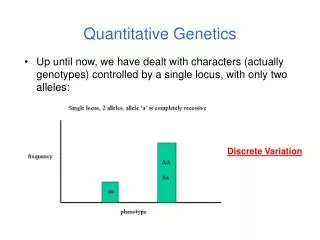
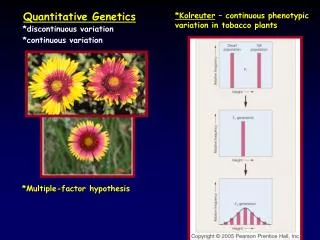
Qualitative and quantitative traits • qualitative or discrete traits: • disease (often dichotomous; assessed by diagnosis): Huntington’s disease, obesity, hypertension, … • serological status (seropositive or seronegative) • Drosophila melanogaster bristle number • quantitative or continuous traits: • height, weight, body mass index, blood pressure, … • assessed by measurement
discrete trait continuous trait (e.g. hypertension) (e.g. blood pressure) 0 1
Pros and cons of disease vs. quantitative trait • disease • for rare disease, limited variation in random sample; need for non-random ascertainment • for late-onset diseases, it is difficult/impossible to find multigenerational pedigrees • diagnosis: often difficult, subjective, arbitrary • treatment may cure disease or weaken symptoms, but original disease status is generally still known • of great clinical interest • often more complex etiologically • continuous trait • sufficient variation in random sample; non-random ascertainment may not be necessary or advisable • as no special ascertainment is necessary, any pedigree is suitable • measurement: often straight-forward, reliable • medications and other covariates may influence phenotype • often only of limited/indirect clinical interest • often simpler etiologically
Dichotomizing quantitative phenotypes generally leads to loss of information unaffected affected
Characterization of a quantitative trait center of distribution spread around center symmetry thickness of tails
How can a continuous trait result from discrete genetic variation? Suppose 4 genes influence the trait, each with 2 equally frequent alleles. Assume that at each locus allele 1 decreases the phenotype of an individual by 1, and that allele 2 increases the phenotype by 1. Now, let us obtain a random sample from the population - by coin tossing. Take 2 coins and toss them. 2 tails mean genotype 11, and phenotype of -2. 2 heads mean genotype 22, and phenotype contribution of +2. 1 head and 1 head is a heterozygote (genotype 12), with phenotype of 0. Repeat this experiment 4 times (once for each locus). Sum up the results to obtain the overall phenotype.
Variance decomposition phenotypic variance due to all causes phenotypic variance due to genetic variation phenotypic variance due to environmental variation
Decomposition of phenotypic variance attributable to genetic variation phenotypic variance due to genetic variation phenotypic variance due to additive effects of genetic variation phenotypic variance due to dominant effects of genetic variation
phenotypic means of genotypes AA AB BB -a 0 d +a
phenotypic means of genotypes AA AB BB -a d=0 +a If the phenotypic mean of the heterozygote is half way between the two homozygotes, there is “dose-response” effect, i.e. each dose of allele B increases the phenotype by the same amount. In this case, d = 0, and there is no dominance (interaction between alleles at the same polymorphism).
Decomposition of phenotypic variance attributable to environmental variation phenotypic variance due to environmental variation phenotypic variance due to environmental variation common among individuals (e.g., culture, household) phenotypic variance due to environmental variation unique to an individual
Definition of heritability The proportion of the phenotypic variance in a trait that is attributable to the effects of genetic variation. The absolute values of variance attributable to a specific factor are not important, as they depend on the scale of the phenotype. It is the relative values of variance matter.
Broad sense andnarrow-sense heritability The proportion of the phenotypic variance in a trait that is attributable to: - effects of genetic variation (broad sense) - additive effects of genetic variation (narrow sense)
trait genes environment “Nature vs. nurture” 0% environmental contribution 100% 100% genetic contribution 0%
Different degrees of relationship havedifferent phenotypic covariance/correlation (assuming absence of effect of shared environment)
MZ and DZ twins havedifferent phenotypic covariance/correlation (assuming equal effect of shared environment)
Normal distribution f(x) x
Variance components approach:multivariate normal distribution (MVN) In variance components analysis, the phenotype is generally assumed to follow a multivariate normal distribution: no. of individuals (in a pedigree) nn covariance matrix phenotype vector mean phenotype vector
Variance-covariance matrix The variance-covariance matrix describes the phenotypic covariance among pedigree members. nn structuring matrix scalar variance component (random effect)
“Sporadic” model:no phenotypic resemblance between relatives In the simplest model, the phenotypic covariance among pedigree members is only influenced by environmental exposure unique to each individual. Shared factors among relatives, such as genetic and environmental factors, do not influence the trait. identity matrix:
Identity matrix m f 2 3 1
Modeling phenotypic resemblance between relatives:“polygenic” model kinship matrix
Kinship and relationship matrix kinship matrix: Each element in the kinship matrix contains probability that the allele at a locus randomly drawn from the 2 chromosomal sets in a person is a copy of the same allele at the same locus randomly drawn from the 2 chromosomal sets in another person. For one individual, f = 0.5, assuming absence of inbreeding. relationship matrix: This provides the probability that a given locus is shared identical-by-descent among 2 individuals. This is equivalent to the expected proportion of the genome that 2 individuals share in common due to common ancestry. For one individual, 2f = 1, assuming absence of inbreeding.
Relationship matrix:nuclear family m f 2 3 1
Relationship matrix:half-sibs f1 m f2 1 2
Likelihood • The likelihood of a hypothesis (e.g. specific parameter value(s)) on a given dataset, L(hypothesis|data), is defined to be proportional to the probability of the data given the hypothesis, P(data|hypothesis): L(hypothesis|data) = constant * P(data|hypothesis) • Because of the proportionality constant, a likelihood by itself has no interpretation. • The likelihood ratio (LR) of 2 hypotheses is meaningful if the 2 hypotheses are nested (i.e., one hypothesis is contained within the other): • Under certain conditions, maximum likelihood estimates are asymptotically unbiased and asymptotically efficient. Likelihood theory describes how to interpret a likelihood ratio.
Inference in heritability analysis H0: (Additive) genetic variation does not contribute to phenotypic variation H1: (Additive) genetic variation does contribute to phenotypic variation heritability:
Modeling phenotypic resemblance between relatives:“polygenic” model allowing for dominance matrix of probabilities that 2 individuals inherited the same alleles on both chromosomes from 2 common ancestors
D7 matrix:nuclear family m f 2 3 1
Inference in heritability analysis H0: (Additive) genetic variation does not contribute to phenotypic variation H1: (Additive) genetic variation does contribute to phenotypic variation 2 degrees of freedom
Is it reasonable to assume that the only source for phenotypic resemblance among relatives is genetic? No. To overcome this problem, one can try to model shared environment, either in aggregate or broken into specific environmental factors. household matrix: accounts for aggregate of environmental factors shared among individuals living in the same household
Household matrix m f 2 3 1
non-nested hypotheses Nested models for heritability analysis
Inclusion of covariates Measured covariates can easily be incorporated as “fixed effects” in the multivariate normal model of the phenotype, by making the expected phenotype different for different individuals as a function of the measured covariates.