Phytoplankton Phenology
70 likes | 104 Vues
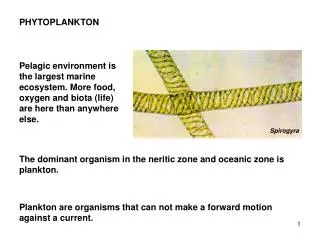
This presentation by Marco Vargas explores the importance of phytoplankton cycles in oceans, their impacts on ecosystems, and the benefits of monitoring them. Learn about modelling, monitoring, and predicting phytoplankton biomass changes. Discover the challenges and future directions in phytoplankton research.

Phytoplankton Phenology
E N D
Presentation Transcript
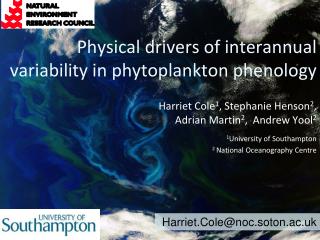
Phytoplankton Phenology Presented by Marco Vargas
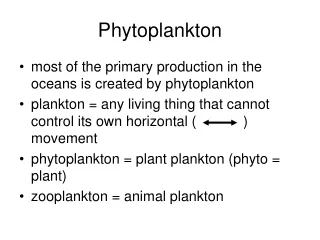
Requirement, Science, and Benefit Requirement / Objective • Ecosystems • Increase number of regional coastal and marine ecosystems delineated with approved indicators of ecological health and socioeconomic benefits that are monitored and understood. • Increase portion of population that is knowledgeable of and acting as stewards for coastal and marine ecosystems. • Climate • Understand and predict the consequences of climate variability and change on marine ecosystems Science • Can we model the annual cycles of phytoplankton and describe the timing and magnitude of phytoplankton biomass in the open ocean? • Can we relate changes in phytoplankton biomass to oceanic variables? • Are there any trends in the timing and magnitude of phytoplankton biomass? Benefit • National Ocean Service and their customers, Ocean Color Community: • Assessing marine ecosystem response to climate change • Ability to monitor and detect changes in distribution of phytoplankton in marine ecosystems • Develop climatology of phenological markers (bloom onset, maturity, beginning of decay and termination) • Detect changes in the annual cycle of phytoplankton biomass
Challenges and Path Forward • Science challenges • Improve atmospheric correction • Need longer time-series • Next steps • Explore different time/spatial resolutions to maximize resolved features • Extend study to global oceans • Develop equivalent algorithms to process NOAA-generated VIIRS/NPP • Transition Path • Generate experimental version from MODIS/SeaWIFS • Generate operationally from MODIS/SeaWIFS for global ocean • Include algorithm development/validation for VIIRS/NPP to provide product continuity • Our goal is to transition the phytoplankton phenology product to operations within the next few years. • End users: National Ocean Service and their customers, Ocean Color Community
Modeling of Bloom Data • Daily SeaWIFS global chlorophyll (4 km res) is aggregated to pentad (five-day) means with a spatial resolution of 3°x3° lat/lon • Highly non Gaussian • Bloom data are non-negative • GLMs (Generalized Linear Models) for Gamma distributed data. • The chlorophyll amount Y is modeled using a Gamma GLM with the canonical log link: • Spatial distribution of the eight models constructed to represent the annual cycle of chlorophyll in the study area Distribution of example grid-box D with estimated distributions overlaid. The black line represents a Gaussian distribution and the red line represents a Gamma distribution
Generalized Linear Models (GLMs) for Gamma distributed data • Gamma distribution was used to model chlorophyll because of its ability to represent • multiple shapes • Variables are added to represent a linear time trend, the annual cycle and linear time trends • in the annual cycle • GLMs are a powerful regression tool that allow for hypothesis testing of the explanatory • variables and for response data with a range of different distributions
Determination of Phenological Markers • Four phenological characteristics are extracted from the annual cycle of modeled chlorophyll concentration: bloom onset , bloom maturity, start of bloom decay and end of bloom. • Above 24ºN, blooms begin in autumn (September – • November) • Reach maturity in late autumn to winter (December • February) • Start to decay in spring (March – May) • Terminate during summer (June – August). • The phenological markers cannot be determined for a large region in the southern portion of the study area because it does not possess a statistically significant annual cycle. In this region (black pixels), the mean represents the best estimate to describe its concentration at any given time. Spatial distribution of (A) bloom onset, (B) bloom maturity, (c) start of bloom decay, and (d) bloom termination