Download
1 / 61
610 likes | 716 Vues
Explore dead material variables in AOD labeled 'All', 'Crack1', 'Crack2'. Investigate jet true eta distribution in events with large fake MET. Analyze jet resolution in large fake MET events using 14.2.20.3 release simulations and J0 to J8 samples. Study the correlation between jet energy in Lar and fake MET. Conclusions on Lar gap and Tile sampling effects on EM fraction. Investigating jets causing eta peak at 0. Comparing jet resolution of all lead jets to poorly reconstructed jets in events with large fake MET.

E N D
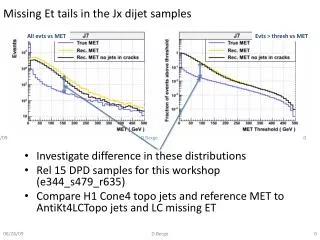
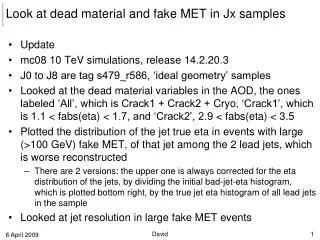
Look at dead material and fake MET in Jx samples • Update • mc08 10 TeV simulations, release 14.2.20.3 • J0 to J8 are tag s479_r586, ‘ideal geometry’ samples • Looked at the dead material variables in the AOD, the ones labeled ‘All’, which is Crack1 + Crack2 + Cryo, ‘Crack1’, which is 1.1 < fabs(eta) < 1.7, and ‘Crack2’, 2.9 < fabs(eta) < 3.5 • Plotted the distribution of the jet true eta in events with large (>100 GeV) fake MET, of that jet among the 2 lead jets, which is worse reconstructed • There are 2 versions: the upper one is always corrected for the eta distribution of the jets, by dividing the initial bad-jet-eta histogram, which is plotted bottom right, by the true jet eta histogram of all lead jets in the sample • Looked at jet resolution in large fake MET events David
J0 Green bullets are always profile plots of the colored 2d histogram! • Next few slides: • Top left: transverse energy in all dead material vs. eta of the lead jet • Top right: for fake MET > 100 GeV, the eta of the rec. jet, among the 2 lead jets, which is poorer reconstructed. Histogram has per bin the number of events for 10 pb-1 • Bottom: Dead material ET depot vs. fake MET, for all dead material, for crack 1 DM and lead jet hitting crack 1, crack 2 DM and lead jet crack 2 David
J1 Green bullets are always profile plots of the colored 2d histogram! David
J2 Green bullets are always profile plots of the colored 2d histogram! David
J3 2e7 ev / 10 pb-1 David
J4 • Eta-corrected: • Divided by all-jets eta spectrum • bin content comparable 1.5e6 ev / 10 pb-1 David
J5 • Eta-corrected: • Divided by all-jets eta spectrum • bin content comparable 5e4 ev / 10 pb-1 ? David
J6 • Eta-corrected: • Divided by all-jets eta spectrum • bin content comparable 1100 ev / 10 pb-1 David
J7 • Eta-corrected: • Divided by all-jets eta spectrum • bin content comparable 11 ev / 10 pb-1 David
J8 • Eta-corrected: • Divided by all-jets eta spectrum • bin content comparable 0.01 ev / 10 pb-1 David
Peak at eta=0 • Due to Tile sampling? • Due to Lar gap (few mm) at eta=0? • Check fraction of jet energy in Lar, and its correlation with fake MET David
J0 jet EM fraction Jet EM fraction vs fake MET Jet EM fraction central (black) vs not-so central (green) Jet EM fraction vs eta lead jet Jet EM fraction vs eta bad jet for large fake MET David
J1 jet EM fraction Jet EM fraction vs fake MET Jet EM fraction central (black) vs not-so central (green) Jet EM fraction vs eta lead jet Jet EM fraction vs eta bad jet for large fake MET David
J2 jet EM fraction Jet EM fraction vs fake MET Jet EM fraction central (black) vs not-so central (green) Jet EM fraction vs eta lead jet Jet EM fraction vs eta bad jet for large fake MET David
J3 jet EM fraction Jet EM fraction vs fake MET Jet EM fraction central (black) vs not-so central (green) Jet EM fraction vs eta lead jet Jet EM fraction vs eta bad jet for large fake MET David
J4 jet EM fraction Jet EM fraction vs fake MET Jet EM fraction central (black) vs not-so central (green) Jet EM fraction vs eta lead jet Jet EM fraction vs eta bad jet for large fake MET David
J5 jet EM fraction Jet EM fraction vs fake MET Jet EM fraction central (black) vs not-so central (green) Jet EM fraction vs eta lead jet Jet EM fraction vs eta bad jet for large fake MET David
J6 jet EM fraction Jet EM fraction vs fake MET Jet EM fraction central (black) vs not-so central (green) Jet EM fraction vs eta lead jet Jet EM fraction vs eta bad jet for large fake MET David
J7 jet EM fraction Jet EM fraction vs fake MET Jet EM fraction central (black) vs not-so central (green) Jet EM fraction vs eta lead jet Jet EM fraction vs eta bad jet for large fake MET David
J8 jet EM fraction Jet EM fraction vs fake MET Jet EM fraction central (black) vs not-so central (green) Jet EM fraction vs eta lead jet Jet EM fraction vs eta bad jet for large fake MET David
Jet EM fraction conclusion • Lar gap or Tile sampling doesn’t seem to be the problem • Lar gap: there isn’t a sharp dip in the EM fraction at eta=0, just the expected gradual increase with eta (coverage effect due to increasing calorimeter thickness) • Tile sampling: • No correlation with fake MET for high Jx samples • More and more energy in Tile, since EM fraction goes down with increasing Jx David
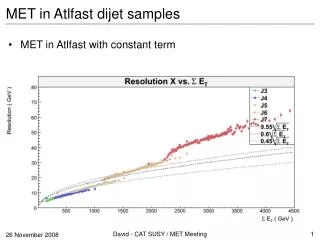
Jet resolution close to eta=0 for large fake MET • So what kind of jets cause the peak at 0? • Compare the jet resolution of all lead jets to the resolution of those jets that are poorly reconstructed in events with large fake MET • Following plots: • Top left: jet resolution vs. true eta, all lead jets • Top right: jet resolution poorly rec. jets, for large fake MET • Bottom: slices through the top right, i.e jet resolution for jet eta close to 0, around 0.7, around 1.5 David
Jet resolution for large fake MET conclusions • Picking out events with large fake MET reveals largely asymmetric tails in the resolution of the worst rec. jet in the event • At eta close to 0 jets are underestimated, at eta close to 0.7 (barrel to extended barrel), we overshoot, at eta close to 1.5 (crack 1, inner detector services) we undershoot again • This can be an effect of the jet reconstruction, but also of the MET reco (selection effect) • First attempt: check it isn’t punch through of central jets • Check MS hits correlation • Will probably need to go into more detail of the jet / MET reconstruction David
Quick look at MS hits David
MS Hits • Clear correlation of MS hits with delta energy • Clearly detector structures are visible • Cut on MS hits of 200 yields overall improvement, but peak at 0 remains David
J0 jet resolution tails David
J1 jet resolution tails David
J2 jet resolution tails David
J3 jet resolution tails David
J4 jet resolution tails David
J5 jet resolution tails David
J6 jet resolution tails David
J7 jet resolution tails David
J8 jet resolution tails David