Download
1 / 79
830 likes | 1.05k Vues
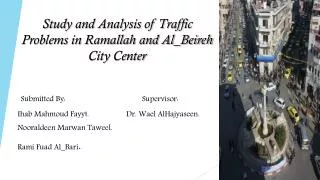
Study and Analysis of Traffic Problems in Ramallah and Al_Beireh City Center Submitted By: Supervisor: Ihab Mahmoud Fayyt. Dr. Wael AlHajyaseen. Nooraldeen Marwan Taweel. Rami Fuad Al_Bari. Case Study.

E N D
Study and Analysis of Traffic Problems in Ramallah and Al_Beireh City Center Submitted By: Supervisor: Ihab Mahmoud Fayyt. Dr. Wael AlHajyaseen. Nooraldeen Marwan Taweel. Rami Fuad Al_Bari.
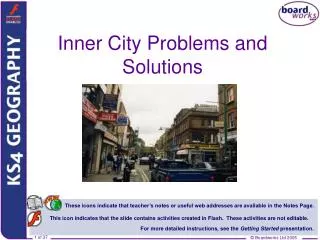
Case Study • Studying the current situation and existing problems of the traffic system in Ramallah and Al-Beireh CBD area. • Collection a required data from different resources. • Analysis of collecting data using traffic programs. • Trying to find the best solution for each links and nodes problems.
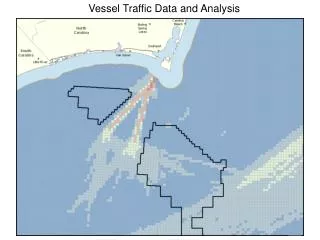
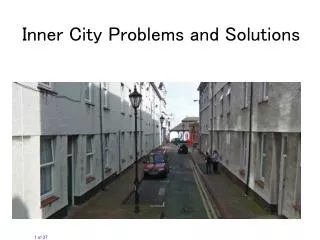
Study area • Study area was selected to be Ramallah and Al-Beireh CBD area. • Most congested intersections and links were included in study in CBD area.
Why this Study Area was selected ??? • The most congested area in the city of Ramallah and Al-Beireh cities, because it connects all parts of the cities with each other.
Concentration of public transportation parking inside CBD area.Distribution of Public Transportation Stations in Study Area.
Literature Review • No periodic studies that needs to meet the development of transportation system in the study area. • The last study was in 2009, and the source study was Universal Group for Engineering and Consulting. map of Previous Study in year 2009.
Literature Review • All data at intersections in the study area were collected manually in 2012 and not to rely on previous studies. • The previous data was used only to estimate the traffic flow in the future, and to determine the growth rate that used in design the level of service.
Collected Data • Traffic flow: 1. Vehicles movements. 2. Crossing Pedestrian. • Intersections and Links Dimensions. • Accident Data. • Traffic control signs.
Traffic Flow – Vehicles movements • Collection a vehicle movements at all bounds at intersections was in November and March in year 2012. • Time of collection data was selected as an estimated Peak time during a day. • It was noticed that the peak time are mainly at PM period, exactly with the end of working hours and schools.
Calculations of vehicles movements include: • Peak Hour (PH). • Peak Hour Volume (PHV). • Peak Hour Factor (PHF). • Percent of Heavy Vehicles (HV). • Average Daily Traffic (ADT). • Design Hourly Volume (DHV).
Example of intersection Calculations Calculations of traffic Movements at intersection I-2 at Al-Nahda Street
Pedestrian Study • Basis of Pedestrian classification based on the age of the pedestrian. • These categories are classified as: • Less than 20 years. • Between 20-50 years. • Greater than 50 years.
Pedestrian Study • Collection of pedestrian flow data was at intersection that pedestrian intersect each approach. • calculations of Pedestrian flow are concentrated to find the peak hour volume for pedestrians that intersect approaches.
Example of Pedestrian Study at each Approach Calculations of Pedestrian Movements at intersection I-3 at Al-Quds Street
Accident Data • Accident Data is an a clear indication of traffic safety in the study area. • Accident data were collected manually from the Palestinian Traffic Police in Ramallah and Al_Beireh city. • The Accident Data were collected to year 2011, and found that was 1651 accident in the study area.
Accident Data • There was many problems are faced during collecting data, its summarized as: 1. Unavailability of computerized accident data and only on the books written information. 2. An emphasis and difficulty on giving information of accident data.
Calculations of Accident Rates • Calculations of accident rates are different between Nodes and Links. • On Nodes: calculation of accident rates are based on The rate per million of entering vehicles (RMEVs) at intersections. • On Links: calculation of accident rates are based on The rate per 100 million vehicle Kilometers (RMVKm).
Calculations of Accident Rates • In calculation of accident rates, An Average Daily Traffic (ADT) are needed in calculation. • ADT are calculated from the equation: ADT = , where: • k is a factor and taken in Ramallah and Al_Beireh City to be equal (0.08). • DHV is assumed to be equals of Peak Hour Volume (PHV).
Accident Rates at Nodes Calculation of Accident Rates at specified nodes in the study area
Causes of Crashes Accident Causes can be classified based on its type as: • rear end collision • Angle collision • side collision • head-on collision • High speed and didn't stop on signal • Rollover collision • Pedestrian collision • fixed object collision Side Collision
Traffic Control signs • Traffic control signs are the best way to regulate the traffic and prevent conflicts. • In the study area there are no signalized intersection and all of intersections have a stop control signs. • Most of traffic signs in the study area are to determine the directions of vehicles movements, pedestrian cross walking, and distribution of Parking and public transportation.
Example of Traffic Signs Study at intersection and connected links Studying of Traffic Signs at Al-Manarah Roundabout (I-8).
Road Inventory studying of road inventory are important to identify the properties of roads: • Intersections and Links dimensions. • number of lanes. • direction of vehicle movements • availability of parking places on the roads.
Example of Road Inventory Intersection Dimensions, Traffic Volumes, and Sidewalk availability at intersection I-1 at Al-Nahda Street.
Data Analysis • Data Analysis is the way to know the current situation of roads based on level of service at intersections. • Data Analysis also includes knowing the effects of accident rates on traffic safety in the study area.
Data Analysis • Analysis of traffic data to find the Level of Service (LOS) by using a software Programs. • Programs were used to analysis data are Highway Capacity Solution (HCS 2000) and SYNCHRO 8.0 Programs. SYNCHRO 8.0 and HCS 2000 face Programs.
Level of Service at existing conditions • After analysis, noticed there are a Weak level of service at intersections. The most was (LOS F) that indicates to high congestion and delay and must to search for solutions to reduce traffic congestion and to improvement traffic safety.
Traffic Signal Warrants Evaluation • One of the most effective ways of controlling traffic at an intersection is the use of traffic signals. • The most important factors that determines the need for traffic signals at a particular intersection is the intersection’s approach traffic volume • other factors such as pedestrian volumes and crash experience may also play a sufficient rule.
Traffic Signal Warrants Evaluation • All Warrants for all intersections are calculated manually and by using SYNCHRO 8 program. • Warrant 1 (eight hour vehicular volume) was not considered because of no eight hour volume accounted at all intersections and no previous eight hour volume account available data. • SYNCHRO 8.0 Program • for Checking Warrants for • Signal Traffic.
Check of Warrants for using Traffic Signals • Intersections I-3 and I-6 did not warranted but it was necessary to design a Signal Traffic to avoid conflict points at intersections due to geometrical design. • Number of Warranted intersections are 6 intersections, and need to design a Traffic Signals.
Intersection Problems and suggested solutions • During the study of intersections and data collection, many problems at intersections were noticed. • These problems are varied from geometric problems such as the design of radii for curves to Non-compliance with traffic rules such as a parking presence at intersections. • There are also some problems such as availability of traffic signs and their conditions, distributions, and where it placed to be visible to all people.
Intersections curves radii • Current conditions for Radii for each curves of intersections were measured by taken the length of curve and found the radius on AutoCAD program. • this radii were compared with the minimum required radii and check which it need to editing or not.
Example of Existing radii at intersections and minimum required radii Existing Radii for Intersection I-6 at Main Street near Rokab Ice-Cream
Example of Existing radii at intersections and minimum required radii Existing and minimum required Radii for Intersection I-6 at Main Street near Rokab Ice-Cream
Intersection I-1: Al-Nahda Street beside Busses station. • First problem is entry the vehicles into taxi’s station near Al-Manarah Roundabout at East Bound. This vehicles enter the station in reverse direction to traffic movement that leads to conflict points and congestion.