Download
1 / 10
100 likes | 239 Vues
The Design of Geographic Information Systems for the Storage and Analysis of Public Health and Environmental Data. Waterscape International Group. Purpose of this Research.

E N D
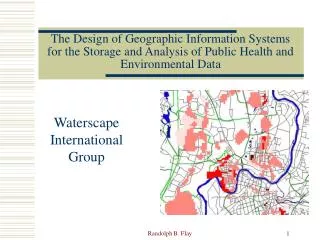
The Design of Geographic Information Systems for the Storage and Analysis of Public Health and Environmental Data Waterscape International Group Randolph B. Flay
Purpose of this Research • Develop a system for the storage and analysis of public health and environmental data to guide decision-making using database and Geographic Information System (GIS) software • Use this system to investigate the effects of air and water quality on public health • Highlight the need for appropriate data storage, analysis, and exchange Randolph B. Flay
Background • Vilnius, capital of Lithuania, population 580,000 • Maps of the city, 20 city districts, 9 distinct water supply networks in the city • Design of the system and show an example of its application to air quality • Extensive restructuring in the ministries involved in environmental and public health data collection, analysis, and dissemination Randolph B. Flay
Overview of Steps Involved • Obtain data on disease rates, water quality, air quality, and basic GIS layers (city features) • Import this data and create meaningful relationships to query the database by city district or water supply district • Export data sets to statistical or mapping packages for analysis • Software used: MS Access, ESRI’s ArcView, MS Excel, Systat. Randolph B. Flay
Data Flow Randolph B. Flay
Data • Age Groups: 1991 & 1992 all ages, 1991-1995 ages 0-100 • Air Quality Index, CO, NO2, SO2 • International Classification of Diseases • Diseases studied Randolph B. Flay
Methods • Two fold aim: First to calculate disease rates and, second, to look for relationships between disease rates and environmental phenomenon • Calculate morbidity rates at the street and district level • Select respiratory diseases for analysis • Simple regression analysis between air quality indicators (Air Pollution Index, CO, NO2, SO2) Randolph B. Flay
Results • General findings of disease rates • Results of the regression analysis • Maps of disease distribution Randolph B. Flay
Discussion • The examination of air quality is meant to be an example of potential applications and not a thorough analysis. • Temperature, social, economic, and other factors may confound the analysis. Time-series analysis. • Training is a very important part of implementing this sort of system. • Some of the software and development can be costly. Randolph B. Flay
Recommendations • General data management: information exchange between government agencies, Internet, publicly available information. Seek ways to standardize information collection among agencies. • In regards to air quality: seek methods of compliance with air quality standards, educate the public about disease prevention Randolph B. Flay