Download
1 / 20
200 likes | 314 Vues
INDICATORS FOR MAINTENANCE OF PRODUCTIVE CAPACITY ON RANGELANDS. R. Dennis Child Professor and Head, Department of Rangeland Ecosystem Science, Colorado State University, Fort Collins, Colorado. Sustainability. Rangeland providing goods and services for the current and future generations.

E N D
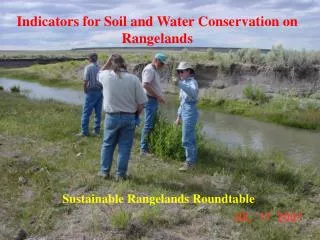
INDICATORS FOR MAINTENANCE OF PRODUCTIVE CAPACITY ON RANGELANDS R. Dennis Child Professor and Head, Department of Rangeland Ecosystem Science, Colorado State University, Fort Collins, Colorado
Sustainability • Rangeland providing goods and services for the current and future generations. • Implies future generations can obtain their desired mix. • Provides a wide variety depending on the mix desired by society at a particular time.
Productive Capacity • More than forage based products. • Both market and non-market goods. • Must include non-consumptive goods. • Wildlife habitat • Open space • Criteria must consider temporal and spatial scale.
Evaluating productive capacity of rangeland must question: “Capacity For What?”
Productive Capacity • An area of rangeland can produce a wide variety of goods and services. • Some are mutually exclusive – Others compatible to some degree. • Seldom is there a linear exchange ratio. (i.e. mixed species grazing.)
Does Removal of Sheep Change the Productive Capacity? Has productive capacity for recreation increased?
Other Questions: • What are the important products, goods, and services that are being produced and which ones can be monitored? • How can issues of fragility and resiliency be considered? • Is it important to assess the cost and benefits to society for producing these products?
Questions Continued: • What products, goods, and services will be desired and produced for future generations? • Can fragility and resiliency be considered? • Is it important to assess societal costs/benefits? • Should natural processes be monitored to account for change in productive capacity?
Indicator #1 • Total acres of rangeland within the context of physiographic regions. • Indicates major shifts in land use that disrupts the production of goods and services from rangeland. • Provides base information for indicators. • Also identified by Ecological Health and Diversity.
Indicator #2 • Percent of available rangeland that Is grazed by livestock. • Provides information on land use patterns that may shift production from one commodity to another use. Considered: • Importance of Ecological State or Condition. • Other market and non-market goods.
Indicator #3 • Number of domestic livestock on rangeland by physiographic region. (Cattle, sheep, goats, horses, and bison) • A direct measure of a consumptive use of rangeland forage. Considered: • Wild horses and burrows. • Using AUMs
Indicator #4 • Number of wildlife harvested by physiographic region. • An indirect measure of wildlife numbers that derive some proportion of their food and habitat requirements from rangeland. • Recognized that wildlife don’t stay on rangeland. • Use major wildlife species (e.g. elk, deer, pronghorn, gage grouse.) • Number harvested, hunters, and success ratios.
Indicator #5 • Acres of invasive and noxious plants by physiographic region. • A measure of the extent to which rangeland productive capacity is altered through changes in the composition of plant species. • Most states inventory weeds by county. • May overlap with Ecological Health and Diversity.
Indicator #6 • Annual removal of non-forage products by physiographic region. • An estimate of the wide variety of other consumptive uses of rangeland. • E.g. Landscape material, mushrooms, seeds, firewood. • Details to be worked out, could be difficult.
Indicator #7 • Annual above ground biomass production by physiographic region. • A measure that integrates the biotic and abiotic factors that determine the annual production from rangeland. • Standing crop a traditional measure. • Potential to be monitored remotely.
Correlation with the Roundtable on Sustainable Forests Criteria/Indicators • Area of forestland and net area of forestland available for timber production. • Total growing stock of both merchantable and non-merchantable tree species on forestland available for timber production. • The area and growing stock of plantations of native and exotic species.
RSR Indicators Continued: • Annual removal of wood products compared to the volume determined to be sustainable. • Annual removal of non-timber forest products (e.g., fur bearers, berries, mushrooms, game), compared to the level determined to be sustainable.
Challenges And Opportunities • The first challenge will be to maintain momentum gained. • The second challenge and/or opportunity will be to link the work of this criterion group with the other groups.
Conclusions and Future Work • Seven indicators have been developed thus far. • Indicators compared: • With minutes taken at all five SRR meetings • With indicators developed in the RSF • The next tasks: • To develop linkages with other criterion groups. • To assess the feasibility of using these indicators.