Interval Visualizer
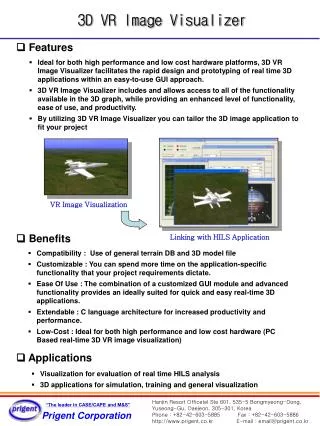
Interval Visualizer. Pete Nordquist Dr. R. Dean Ayers Daisuke Kato, Lewis Nakao, Justin Corn Southern Oregon University Work partially supported by the Veneklasen Foundation. Purpose. Train musicians to hear just intervals Experiment with timbral influences on pitch perception.

Interval Visualizer
E N D
Presentation Transcript
Interval Visualizer Pete Nordquist Dr. R. Dean Ayers Daisuke Kato, Lewis Nakao, Justin Corn Southern Oregon University Work partially supported by the Veneklasen Foundation
Purpose • Train musicians to hear just intervals • Experiment with timbral influences on pitch perception. • Demonstrate the differences between equal tempered and just intervals
Frequency Graphing Technique • Computer generates the reference frequency as a sine wave and sounds it. • Computer generates fundamental frequency by dividing the reference frequency by the denominator of the ratio of the user’s chosen target interval. • User sounds the input (target) frequency. • Fundamental sinusoid moves the pen that is drawing the reference (unit) circle, and the drawn point is modified by adding the input to the circle radius whenever the input is positive.
‘Tuning’ using the Figure • User is looking for a figure having the number of “bumps” shown in the numerator of the ratio of their chosen interval. • Figure spins counterclockwise when input is low, clockwise when it is high.
Input Filter • User input is converted to a sine wave to simplify the resulting figure • Conversion is accomplished by doing an FFT and choosing the “bin” with the largest amplitude.
Pitch Perception • Set the timbre of the reference frequency by clicking Options button then choose triangle or sawtooth. • I have found a sinusoidal reference causes me to sing a higher target frequency than does a triangular reference. • A sawtooth seems easier to tune against than either a sinusoid or triangle.
Just vs Equal • Choose a reference frequency • Sound Equal tempered target • Select intervals using number keys to ‘play’ a scale or melody • Stop Equal target and sound Just target • Repeat melody listening for differences • Sound both targets simultaneously and listen to beats for each interval
Future work • Adding functionality to supply arbitrary reference and target timbres and tune them to continue the pitch perception work. • Thinking about a visualization for showing differences in timbre as well as pitch.
Where Can I Get It? • The Interval Visualizer is freely available from: http://www.sou.edu/cs/Nordquist/tuning/index.html
Perfect 5th - 3rd partial - a Filter chose the 9th partial, because it is the strongest frequency.