LANL Trace Visualizer: Animation for Processes and I/O Operations
The LANL Trace Visualizer provides an animated representation of processes interacting with files via I/O operations. Circles represent processes, while enclosing rectangles denote nodes. Arrows illustrate I/O between processes and files, with internal rectangles color-coded to signify the issuing process. This tool reads LANL trace files, showcasing animations of process I/O actions over time, along with descriptive text. The static version summarizes IO activities as cumulative functions of time, differentiating reads and writes through color coding and detailed graphs.

LANL Trace Visualizer: Animation for Processes and I/O Operations
E N D
Presentation Transcript
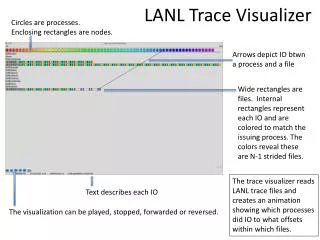
LANL Trace Visualizer Circles are processes. Enclosing rectangles are nodes. Arrows depict IO btwn a process and a file Wide rectangles are files. Internal rectangles represent each IO and are colored to match the issuing process. The colors reveal these are N-1 strided files. The trace visualizer reads LANL trace files and creates an animation showing which processes did IO to what offsets within which files. Text describes each IO The visualization can be played, stopped, forwarded or reversed.
LANL Trace Static Visualizer This is a trace of the checkpoint dump phase of an application which is why it is exclusively writes and no reads. Notice this shows IO as a function of time but does not show the pattern of IO (i.e. N-1 or N-N). • Reads LANL trace files. • Produces a single snapshot showing all cumulative IO as a function of time. • Each color represents a different file. • The y-axis is the cumulative amount of IO to that file. • Above 0 is data written to the file, below is data read • The x-axis is time.