Analyzing Race Times and Outliers in Student Performance Data
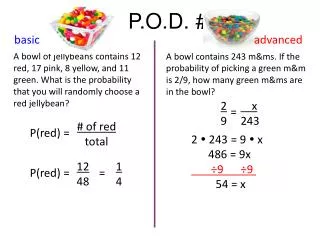
This report analyzes the race times of Houston students running the Broad Street Run, exploring statistical measures including mean, median, mode, and range. The recorded times were 2.5, 2.0, 1.8, 2.8, 3.0, 12.5, and 2.5 hours, resulting in a mean of 3.9 hours, a median of 2.5 hours, a mode of 2.5 hours, and a range of 10.7 hours. Additionally, it discusses the concept of outliers through examples, highlighting the impact of an outlier on statistical measures and recalculating the mean when excluding it, which yields a score of 83%.

Analyzing Race Times and Outliers in Student Performance Data
E N D
Presentation Transcript
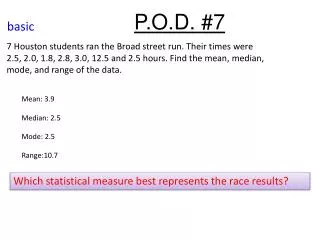
P.O.D. #7 basic 7 Houston students ran the Broad street run. Their times were 2.5, 2.0, 1.8, 2.8, 3.0, 12.5 and 2.5 hours. Find the mean, median, mode, and range of the data. Mean: 3.9 Median: 2.5 Mode: 2.5 Range:10.7 Which statistical measure best represents the race results?
Outliers An outlier is a value that "lies outside" (is much smaller or larger than) most of the other values in a set of data. For example in the scores 25,29,3,32,85,33,27,28 both 3 and 85 are "outliers".
Identify the outlier and describe how it effects the mean, median, mode and range: The following table gives the math scores of6friends: If the score of the outlier is not included, what is the mean score? The mean if the outlier is not included is 83%