Download
1 / 25
250 likes | 352 Vues
This document presents an analysis of location and dispersion effects in a 2^4 factorial design experiment aimed at optimizing a heat treatment process for truck leaf springs. We explore methods for modeling both the mean and variance of outcome measurements, using regression techniques to fit the data. Key components include normal probability plots, loss function assessment, and variance modeling based on treatment factors. Our objective is to minimize variability while keeping the process mean near the target of 8 inches for the free height quality characteristic.

E N D
Stat 470-11 • Today: More Chapter 3
Analysis of Location and Dispersion Effects • The epitaxial growth layer experiment is a 24 factorial design • Have looked at ways to analyze response of a factorial experiment • Plotting effects on a normal probability plot • Regression • May wish to model mean and also the variance
Analysis of Location and Dispersion Effects • Recall, from Section 3.2, the quadratic loss function • The expected loss E(y,t)=cVar(y)+c(E(y)-t)2 suggested • Selecting levels of some factors to minimize V(y) • Selecting levels of other factors to adjust the mean as close as possible to the target, t. • Need a model for the variance (dispersion)
Analysis of Location and Dispersion Effects • Let be the sample mean of observations taken at the ith treatment of the experiment • Let si2 be the sample variance of observations taken at the ith treatment of the experiment • That is, • Can model both the mean and variance using regression
Analysis of Location and Dispersion Effects • Would like to model the variance as a function of the factors • Regression assumes that quantities measured at each treatment be normally distributed • Is it likely that is normally distributed?
Example: Original Growth Layer Experiment • Model Matrix for a single replicate:
Example: Original Growth Layer Experiment • Effect Estimates and QQ-Plot:
Example: Original Growth Layer Experiment • Regression equation for the mean response:
Example: Original Growth Layer Experiment • Dispersion analysis:
Example: Original Growth Layer Experiment • Regression equation for the ln(s2) response:
Example: Original Growth Layer Experiment • Suggested settings for the process:
Example: Original Growth Layer Experiment • Suggested settings for the process in the original units of the factors:
Location-Dispersion Modeling • Steps:
Example • An experiment was conducted to improve a heat treatment process on truck leaf springs • The heat treatment process, which forms the curvature of the leaf spring, consists of • Heating in a furnace • Processing by machine forming • Quenching in an oil bath • The height of an unloaded spring, known as the free height, is the quality characteristic of interest and has a target of 8 inches
Example • The experiment goals are to • Minimize the variability about the target • Keep the process mean as close to the target of 8 inches as possible • A 24 factorial experiment was conducted with factors: • A. Furnace Temperature • B. Heating Time • C. Transfer Time • Q. Quench Oil Temperature • There were 3 replicates of the experiment
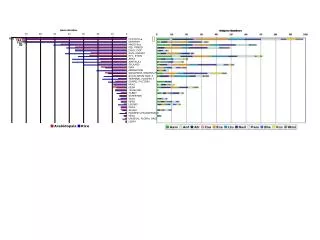
Example • Data
Example • Data
Example • Regression equation for the mean response:
Example • Regression equation for the dispersion responses: