Sustainability
Sustainability. Jess Everett. The Tragedy of the Commons. www.garretthardinsociety.org Garret Harding, Science 162 (1969) Cartoon – The Rusty Oracle. www.qwantz.com. The Tragedy of the Commons. farm5.static.flickr.com. The Tragedy of the Commons. Sustainable Development.

Sustainability
E N D
Presentation Transcript
Sustainability Jess Everett
The Tragedy of the Commons www.garretthardinsociety.org Garret Harding, Science 162 (1969) Cartoon – The Rusty Oracle
www.qwantz.com The Tragedy of the Commons
farm5.static.flickr.com The Tragedy of the Commons
Sustainable Development • Development that meets the needs of the present without compromising the ability of future generations to meet their own needs • Brundtland Commission (1987) • What does this mean to you? • Do you agree?
What do we NEED? • Development that meets the needs of the present without compromising the ability of future generations to meet their own needs • Water • Food • Clothing • Shelter • Health • Security • Waste Assimilation • Travel • Entertainment
Environment • Which of our needs do we get from the Earth (the environment)? All of them!
Sustainable Engineering - Civil Engineering Needs Civil Engineering • Water • Food • Clothing • Shelter • Health • Security • Waste Assimilation • Travel • Entertainment • Environmental & Water Resources • Env & Wat Res & Transportation • Trans & Structural • Struc, Geotechnical • Env, Wat Res & Trans • All • Env & Wat Res • Trans & Struc • All
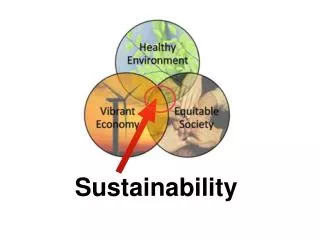
Sustainability Population Technology Life Style Environment
Small Population • Earth - big relative to Population • Natural systems can meet needs of small population • Water, food, wood, stone, fabrics, fossil fuels,… • Wide Range of Technologies OK • Wide Range of Life Styles OK • Efficient to Wasteful • Frugal to Wasteful
Frugal Life Style • Earth - big relative to Life Style • People live simply, minimizing their environmental impact • Vegetarianism, little travel, small homes,… • Wide Range of Populations OK • Wide Range of Technologies OK Life Style Population Technology • Small to Moderately Large • Efficient to moderately Wasteful
Efficient Technologies • Earth - big relative to Technology • Efficient Technologies meet our needs with minimum environmental impact • Renewable energy, fuel efficient travel, high efficiency homes,… • Wide Range of Populations OK • Wide Range of Technologies OK Technology Population Life Style • Small to Moderately Large • Efficient to moderately Wasteful
What Impacts the Pillars? • Population • Health • Education & family planning • Government • Religion • Life Style • Culture • Opportunity • Government • Religion • Technology • Created by engineers • Guided by government
Kunzig, R. (2011) “7 Billion - By 2045 global population is projected to reach nine billion. Can the planet take the strain?”National Geographic Magazine, January Growth Rate • Fertility decline sweeping Earth • First in Industrialized world • But took centuries • Happened later in rest of world • But much faster • ~16% of population still has high birth rate • Mostly in Africa
en.wikipedia.org Population predictions
www.eou.edu Population Distribution
Jeroen, C., M. Van Den Bergh, P. Rietveld (2004) “Reconsidering the Limits to World Population: Meta-analysis and Meta-prediction, BioScience, 54(3). How Many is Too Many? • What is the World Carrying Capacity • 100 Million People? • 1 Billion? • 10 Billion? • 100 Billion? • Estimating World Carrying Capacity • Estimated many times since 1600’s • 96 Estimates range from 1 to 1021 B! • 50 from 1 to 10 B • 33 from 10 to 80 B • 13 > 80 B? • 3 estimates over 109 B, assumed • body heat can be removed (dissipated) • human food based on algae • all carbon on Earth is people or algae Population Life Style Technology
Jeroen, C., M. Van Den Bergh, P. Rietveld (2004) “Reconsidering the Limits to World Population: Meta-analysis and Meta-prediction, BioScience, 54(3). Limiting Factors • 90 estimates • Land / Food (71) • Water Availability (1) • Energy (3) • Carbon (4) • Heat Removal (1) • Primary Production (4) • Forest Products (1) • Nonrenewable Resources (3) • Multiple Factors (2) • Most limiting • fresh water availability • forest products • nonrenewable products such as fertilizer Waste Assimilation?
www.umac.org Population Limit - Water • Total Fresh Water • 37.5 M km3 • Drinking water needed per day • 2 L/person/d • = 2.0E-12 km3/person/d • Maximum Population • 37,500,000 / 2.0E-12 = 19E21 • Why is this wrong?
Why is 19E21 too many? • Social • No Baths! • Environmental • >2/3 of the freshwater is unavailable • No water for other species (including food) • Impossible to treat waste fast enough • Not enough energy from sun Why not make more fresh water?
www.globalchange.umich.edu Population Limit - Water • In 2006, 6 B people used ~ 30% of accessible renewable water • Accessible water not distributed well • South America: 5 % population & 26 % of runoff • Asia: 60 % population & 36 % of runoff • 1 B don’t have good access to water • We are using fossil water • By 2025 could reach 70% • What about other species?
Population Limit - Land • Total Land Area • 150 M km2 (~30 %) • Standing Person Area • 2 ft2/person = 1.858E-7 km2/person • Maximum Population • 150,000,000 / 1.858E-7 = 807 T • T – tera – 1012 • Why is this wrong? It’s too low: multiple stories, below ground, ocean floor…
Why is 807 T wrong? • Health • We don’t sleep standing up • Social • We’d kill each other • Environmental • No land to grow food • No room for other species • Impossible to treat waste • Not enough energy from sun
Population Limit – Agricultural Land • Thomas Robert Malthus (1766 –1834) • “An Essay on the Principle of Population”, 1798 – 1826 • Assumed • Population can increase geometrically • Food Production can only increase arithmetically • Predicted that population would outstrip food supply in less than a century • What happened? – Technology! • The Green Revolution • Fertilizer, Tractors, Hybrid Seeds • Can Africa Join green revolution? • Can agricultural technology continue to improve?
ShunjiMurai, S. (1996) “Global environment and population carrying capacity”, The UNU global environmental Forum IV, Edited by Juha I. Uitto and Akiko Ono, The United Nations University, Tokyo, Japan. Population Limit – Agricultural land • Assumptions • Potential arable land - 21,375,000 km2 • Potential agricultural productivity - 8,923E12 kcal/yr • World Carrying Capacity • 7.34 B • At each country’s 1996 food consumption level • 8.97 B • At world country-average • 4.01 B • At North American consumption rate
www.bestfootforward.com • Wackernagel and Rees, Our ecological footprint; New Society Publications, 1996 • & en.wikipedia.org Ecological Footprint • Area of Earth's surface necessary to sustain levels of resource consumption and waste discharge by given population • Measured in global hectares (gha) of biologically productive area • 1 hectare = 2.5 acres, 1 acre = 43,560 ft2 • In 2006 • Worldwide, 1.8 gha/person • 6.5 B x 1.8 gha = 11.7 B gha • USA average is 9.0 gha/person • 5Earths needed for everyone to live like us! • China average = 1.8 gha • Is current population too big? • Supported by nonrenewable fossil fuels
lamarguerite.files.wordpress.com Consumption
Morton, SA., and M. Sharma, (2009) “Thermodynamic Considerations in Determining World Carrying Capacity,” ASEE Annual Conference, Arlington, TX Earth Energy & Mass Balance 127,500 TW/yr available for plants 177,500 TW/year Reflected: 50,000 TW/year Atmosphere: 3.4E7 kg/yr Space Dust: 1.5E8 kg/yr Space dust accumulation: 66 cm over 4.5 B years
Morton, SA., and M. Sharma, (2009) “Thermodynamic Considerations in Determining World Carrying Capacity,” ASEE Annual Conference, Arlington, TX How much of the sun’s energy can we use? • Photosynthesis • Plants use sun’s energy to grow • Primary Productivity • Net Primary Productivity • Plant products available for use by other entities • NPP 2.9E13 Kg/yr Carbon • Humans currently use ~ 41 % of NPP • We are only one of 5-10 M species on Earth! • A human caused major extinction event is occurring • What happens as we use more photovoltaic?
Morton, SA., and M. Sharma, (2009) “Thermodynamic Considerations in Determining World Carrying Capacity,” ASEE Annual Conference, Arlington, TX Homocene • 5 major extinction events recorded in past • We appear to be in a 6th • Some are calling it the Homocene • Humans appear to be the cause www.personal.psu.edu
Morton, SA., and M. Sharma, (2009) “Thermodynamic Considerations in Determining World Carrying Capacity,” ASEE Annual Conference, Arlington, TX Population Estimate - NPP • Human population limit (HPL) function of? • How much Carbon humans need • ~ 1200 kg per capita Carbon • Fraction NPP we allocate for ourselves, HNPP • HPL = HNPP x 2.9E13 /1200 • = HNPP x 24,200,000,000 • If HNPP should be 10 % • HPL = 0.1 x 24,200,000,000 = 2.4 B • If HNPP should be 41 % and we use 1200 kg • HPL = 0.41 x 24,200,000,000 = 9.9 B
Population - Conclusion • World Carrying Capacity • Between 2 and 10 B? • Higher number requires changes • Life style (developing countries) • Technology
Life Style • Food • Shelter • Travel • Health Care • Water
en.wikipedia.org Quality of Life vs Ecological Footprint
www.ers.usda.gov World Food Spending
www.ers.usda.gov Food Quality • Meat as % of Total Calories • Low income countries • 4 % • Lower middle income countries • 7 % • Upper middle income countries • 11 % • High income countries • 13 % • Cereals • High income countries substitute higher cost cereals • Breakfast cereal for cornmeal or rice
www.nahb.com; www.census.gov & www.eia.doe.gov Shelter • USA average home area • 1970 - 1,400 ft2 • 2004 - 2,330 ft2 • USA average household size • 1970 – 3.14 people • 2003 – 2.57 people • Roughly 40% of US energy consumption in 2008 was used in buildings (~38 quadrillion Btu)
news.bbc.co.uk % houses with ≥ 5 rooms
Buildings • Buildings use ~75% of world’s electricity • Commercial and Residential • Most are energy wasters • US Green Building Council • LEEDs Certification • Leadership in Energy and Environmental Design
www.theautoinsurance.com Travel - Cars
www.theautoinsurance.com Travel - Cars
www.theautoinsurance.com Travel – Travel Mode and Obesity
www.good.is Gallons/Passenger to go 350 miles
www.randallhyman.com frank.itlab.us Bike Transport
www.eia.doe.gov Travel - US
www.eia.doe.gov US Energy Consumption by Transportation