Download
1 / 15
150 likes | 166 Vues
Prediction of Consensus Tropical Cyclone Track Forecast Error (2005-2010) James S. Goerss NRL Monterey March 1, 2011. Predicting TC Track Forecast Error.

E N D
Prediction of Consensus Tropical Cyclone Track Forecast Error (2005-2010) James S. Goerss NRL Monterey March 1, 2011
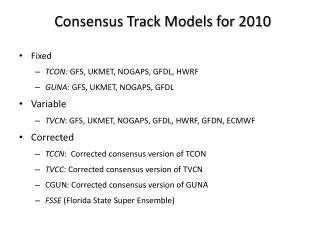
Predicting TC Track Forecast Error • Predictors of consensus forecast error must be quantities that are available prior to the time when official forecasts must be issued. • Consensus model spread is defined to be the average distance of the member forecasts from the consensus forecast. • The possible predictors are consensus model spread; initial and forecast TC intensity; initial TC location and forecast displacement of TC location (latitude and longitude); TC speed of motion; and number of members available (for TVCN/CONU).
Predicting TC Track Forecast Error • Using stepwise linear regression and the aforementioned pool of predictors for a number of previous seasons, regression models were found to predict consensus TC track forecast error for each combination of forecast length, consensus model, and basin. • The regression models were then used to determine the radii of circular areas drawn around the consensus model forecast positions within which the verifying TC position was expected to be contained approximately 70% of the time. • These circular areas were graphically displayed on the ATCF for use by the forecasters at NHC and JTWC. This graphical predicted consensus error product is referred to as GPCE (“gypsy”).
48-h Predicted Consensus Error Hurricane Rita - 06Z 22 September 2005
Atlantic 2005-2010
Number of Verifying Official Forecasts for the Atlantic Basin
2005-2010 Atlantic CONU/TVCN Forecast Error (nm) Consensus error has decreased due to model improvements and the addition of more “good” models (ECMWF, HWRF) Forecast Improvement 22% 18% 15% 12% 7%
GPCE Validation 2005-2010 Atlantic * 2005-2010 Average GPCE Validation (Percent) CONU/TVCN Forecast Error (nm) * * * * * * * * * *
Number of Verifying Official Forecasts for the Eastern North Pacific Basin
2005-2010 Eastern North Pacific CONU/TVCN Forecast Error (nm) Consensus error has decreased due to model improvements and the addition of more “good” models (ECMWF, HWRF) -2% Forecast Improvement 8% 14% 15% 12%
GPCE Validation 2005-2010 Eastern North Pacific * 2005-2010 Average GPCE Validation (Percent) CONU/TVCN Forecast Error (nm) * * * * * * * * * *
Summary • The reduction in consensus forecast error for the Atlantic for the 2008-2010 seasons over that for the 2005-2007 seasons was 7%, 12%, 15%, 18%, and 22% for 24h, 48h, 72h, 96h, and 120h, respectively. • For the 2005-2010 Atlantic seasons, the circular areas displayed by GPCE contained the verifying TC position 75%, 76%, 76%, 79%, and 79% of the time at 24h, 48h, 72h, 96h, and 120h, respectively. • For the 2005-2010 Atlantic seasons, the predicted radii for TVCN/CONU varied from 30-205 nm at 24h, 55-285 nm at 48h, 60-385 nm at 72h, 135-590 nm at 96h, and 180-840 nm at 120h. (2010 NHC Potential Day 1-5 Track Area graphic used 62, 108, 161, 220, and 285 nm, respectively)
Summary • The reduction in consensus forecast error for the eastern North Pacific for the 2008-2010 seasons over that for the 2005-2007 seasons was 12%, 15%, 14%, 8%, and -2% for 24h, 48h, 72h, 96h, and 120h, respectively. • For the 2005-2010 eastern North Pacific seasons, the circular areas displayed by GPCE contained the verifying TC position 71%, 73%, 79%, 80%, and 82% of the time at 24h, 48h, 72h, 96h, and 120h, respectively. • For the 2005-2010 eastern North Pacific seasons, the predicted radii for TVCN/CONU varied from 20-115 nm at 24h, 40-235 nm at 48h, 90-370 nm at 72h, 115-455 nm at 96h, and 160-535 nm at 120h. (2010 NHC Potential Day 1-5 Track Area graphic used 59, 102, 138, 174, and 220 nm, respectively)