Advanced Science Mapping Models for Research Analysis
Explore innovative models for mapping scientific research, including disciplinary diffusion, journal clusters, accuracy measures, and bias analysis. Enhance your understanding of large-scale research landscapes.

Advanced Science Mapping Models for Research Analysis
E N D
Presentation Transcript
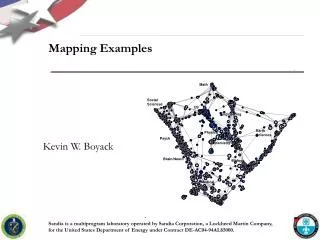
Math Social Sciences CS Engineering Earth Sciences Physics Psych Chemistry Brain/Neuro Biology Medical Mapping Examples Kevin W. Boyack Sandia is a multiprogram laboratory operated by Sandia Corporation, a Lockheed Martin Company, for the United States Department of Energy under Contract DE-AC04-94AL85000.
Macromodel: “Best” Map • Each dot is one journal • Journals group by discipline • Labeled by hand Boyack, K.W., Klavans, R., & Börner, K.(2005, in press). Mapping the backbone of science. Scientometrics.
Macromodel: Structural Map • Clusters of journals denote disciplines • Lines denote strongest relationships between disciplines • Enables disciplinary diffusion studies • Enables comparison of institutions by discipline Boyack, K.W., Klavans, R., & Börner, K.(2005, in press). Mapping the backbone of science. Scientometrics.
Math Social Sciences CS Engineering Earth Sciences Physics Psych Chemistry Brain/Neuro Biology Medical Disciplinary S&T Model - Details • Uses combined SCIE/ SSCI/ISI Proceedings from 2003 • 7445 journals, 1198 proceedings • journals, proceedings treated equivalently • Bib coupling of journals • Initial ordination and clustering of journals gave 852 clusters • Coupling counts reaggregated at the journal cluster level; ordination of journal clusters • (x,y) positions for each journal cluster, journal
Math Social Sciences CS Engineering Earth Sciences Physics Psych Chemistry Brain/Neuro Biology Medical Research Community Model - Details • Uses combined SCIE/ SSCI/ISI Proceedings from 2003 • 997,775 papers from 8643 sources • Bib coupling of papers • Initial ordination and clustering of journals gave 117,433 clusters • Cluster positions calculated using journal positions from the disciplinary map
Journal-level: Local Accuracy Similarity measures • For each similarity measure, journal pairs were assigned a 1/0 binary score if they were IN/OUT of the same ISI category • Accuracy vs. coverage curves were generated for each similarity measure • For each similarity measure, distances (in the VxOrd layouts) between journal pairs were calculated • Accuracy vs. coverage curves were generated for each re-estimated (distance) similarity measure • Results after running through VxOrd were more accurate than the raw measures • Inter-citation measures are best After VxOrd Klavans, R., & Boyack, K.W. (in press). Identifying a better measure of relatedness for mapping science. Journal of the American Society for Information Science and Technology.
Journal-level: Regional Accuracy • For each similarity measure, the VxOrd layout was subjected to k-means clustering using different numbers of clusters • Resulting cluster/category memberships were compared to actual category memberships using entropy/mutual information method • Increasing Z-score indicates increasing distance from a random solution • Most similarity measures are within several percent of each other Boyack, K.W., Klavans, R., & Börner, K.,(submitted). Mapping the backbone of science. Scientometrics.
60% Local Accuracy 70% 60% Local Accuracy (%yes) 70% K50 (aggregated) RawFreq (aggregated) K50 (paper) RawFreq (paper) % Coverage Local Accuracy (Current Papers) 60% Local Accuracy (%yes) 70% K50 (aggregated) RawFreq (aggregated) K50 (paper) RawFreq (paper) % Coverage Local Accuracy (Reference Papers) Paper-level: Local Accuracy • Two maps (current and reference), two measures (raw and modified cosine), two aggregation levels • For each similarity measure, paper pairs, ordered by distance on the map, were assigned a 1/0 binary score if they were IN/OUT of the same ISI category • Accuracy vs. coverage curves were generated for each similarity measure • K50 measures have high accuracy at high coverage Klavans, R., & Boyack, K.W. (under review). Quantitative evaluation of large maps of science. Scientometrics.
RawFreq (paper) RawFreq (aggregated) K50 (paper) K50 (aggregated) Disciplinary Bias Disciplinary Bias (Current Papers) RawFreq (paper) RawFreq (aggregated) K50 (paper) K50 (aggregated) Small[1999] Disciplinary Bias Disciplinary Bias (Reference Papers) Paper-level: Disciplinary Bias • Two maps (current and reference), two measures (raw and modified cosine), two aggregation levels • Disciplinary bias measures effect of thresholding with coverage • K50 measures have lowest bias Klavans, R., & Boyack, K.W. (under review). Quantitative evaluation of large maps of science. Scientometrics.
K50 (paper) RawFreq (paper) RawFreq (aggregated) K50 (aggregated) Log (Size of Cluster) Log (Rank Size) Cluster Size (Current Papers) RawFreq (paper) K50 (paper) RawFreq (aggregated) K50 (aggregated) Log (Size of Cluster) Log (Rank Size) Cluster Size (Reference Papers) Paper-level: Cluster Distributions • Two maps (current and reference), two measures (raw and modified cosine), two aggregation levels • Cluster size distributions – smaller clusters are usually better – chaining can create communities that are too large • K50 measures have fewer large clusters Klavans, R., & Boyack, K.W. (under review). Quantitative evaluation of large maps of science. Scientometrics.
Paper-level: Text Analysis • Current map, K50 similarity • Multidocument summarization • cluster cohesiveness calculated using abstracts for all clusters • compared to values from random clusters • 98.3% of the actual clusters of size 10 are more cohesive than random at p<0.0001 each
Math Social Sciences CS Engineering Earth Sciences Physics Psych Chemistry Brain/Neuro Biology Circle size – number of topics Percent conference papers 0-25% 25-50% 50-75% 75-100% Medical Worldwide S&T
Math Social Sciences CS Engineering Earth Sciences Physics Psych Chemistry Brain/Neuro Biology Circle size – number of topics Vitality (use of newer ideas) >10% more vital than world 0-10% more vital than world 0-10% less vital than world >10% less vital than world Medical DOE Profile
Math Social Sciences CS Engineering Earth Sciences Physics Psych Chemistry Brain/Neuro Biology Circle size – number of topics Vitality (use of newer ideas) >10% more vital than world 0-10% more vital than world 0-10% less vital than world >10% less vital than world Medical Sandia Profile
Math Social Sciences CS Engineering Earth Sciences Physics Psych Chemistry Brain/Neuro Biology Circle size – number of topics Vitality (use of newer ideas) >10% more vital than world 0-10% more vital than world 0-10% less vital than world >10% less vital than world Medical A Specific University Profile
Math Social Sciences CS Engineering Earth Sciences Physics Psych Chemistry Brain/Neuro Biology Circle size – number of topics Vitality (use of newer ideas) >10% more vital than world 0-10% more vital than world 0-10% less vital than world >10% less vital than world Medical Potential SNL/Univ Collaborations
Math Law Computer Tech Policy Statistics Economics CompSci Phys-Chem Vision Chemistry Education Physics Psychology Brain Environment GeoScience Psychiatry MRI Biology BioChem Bio- Materials Microbiology Plant Cancer Animal Infectious Diseases Virology Identifying Opportunities/Threats (36 Research Communities that will impact GI Research… that GI Researchers are least likely to be aware of) GI
Math Law Computer Tech Policy Statistics Economics CompSci Phys-Chem Vision Chemistry Education Physics Psychology Brain Environment GeoScience Psychiatry MRI Biology BioChem Bio- Materials Microbiology Plant Cancer Animal Infectious Diseases Virology Identifying Core Competency Funding patterns of the National Science Foundation (NSF) GI
Math Law Computer Tech Policy Statistics Economics CompSci Phys-Chem Vision Chemistry Education Physics Psychology Brain Environment GeoScience Psychiatry MRI Biology BioChem Bio- Materials Microbiology Plant Cancer Animal Infectious Diseases Virology Identifying Core Competency Funding patterns of the National Institutes of Health (NIH) GI
Math Law Computer Tech Policy Statistics Economics CompSci Phys-Chem Vision Chemistry Education Physics Psychology Brain Environment GeoScience Psychiatry MRI Biology BioChem Bio- Materials Microbiology Plant Cancer Animal Infectious Diseases Virology Identifying Core Competency Funding patterns of the US Department of Energy (DOE) GI
Potential Uses of Science Maps • Overlays • Topic distribution • Opportunity/threat assessment • Core competency identification • Funding (amount) patterns • Impact patterns • Relationships • Interdisciplinary • Community level between disciplines
Related Publications • Boyack, K. W., Klavans, R. & Börner, K. (2005, in press). Mapping the backbone of science. Scientometrics. • Klavans, R. & Boyack, K. W. (2005, in press). Identifying a better measure of relatedness for mapping science. Journal of the American Society for Information Science and Technology. • Boyack, K. W., & Rahal, N. (2005, in press). Evaluation of LDRD investment areas at Sandia. Technological Forecasting and Social Change. • Boyack, K. W., Mane, K. & Börner, K. (2004). Mapping Medline papers, genes and proteins related to melanoma research. IEEE Information Visualization 2004, 965-971. • Boyack, K. W. (2004). Mapping knowledge domains: Characterizing PNAS. Proceedings of the National Academy of Sciences 101(S1), 5192-5199. • Boyack, K. W., & Börner, K. (2003). Indicator-assisted evaluation and funding of research: Visualizing the influence of grants on the number and quality of research papers. Journal of the American Society for Information Science and Technology 54(5), 447. • Börner, K., Chen, C., & Boyack, K. W. (2003). Visualizing knowledge domains. Annual Review of Information Science and Technology 37, 179-255. • Werner-Washburne, M., Wylie, B., Boyack, K., Fuge, E., Galbraith, J., Fleharty, M., Weber, J., & Davidson, G.S. (2002). Concurrent analysis of multiple genome-scale datasets. Genome Research 12(10), 1564-1573. • Boyack, K. W., Wylie, B. N., & Davidson, G. S. (2002). Information visualization, human-computer interaction, and cognitive psychology: Domain visualizations. Lecture Notes in Computer Science 2539, 145-160. • Boyack, K. W., Wylie, B. N., & Davidson, G. S. (2002). Domain visualization using VxInsight for science and technology management. Journal of the American Society for Information Science and Technology, 53(9), 764-774. • Davidson, G. S., Wylie, B. N., & Boyack, K. W. (2001). Cluster stability and the use of noise in interpretation of clustering. Proc. IEEE Information Visualization 2001, 23-30. • Boyack, K.W., Wylie, B.N., Davidson, G.S. & Johnson, D.K., Analysis of patent databases using VxInsight. Presented at New Paradigms in Information Visualization and Manipulation 2000, McLean, VA, Nov. 10, 2000.