Download
1 / 3
30 likes | 127 Vues
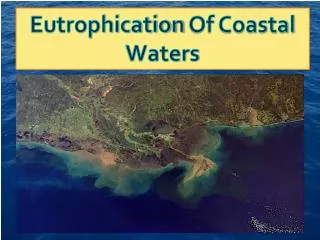
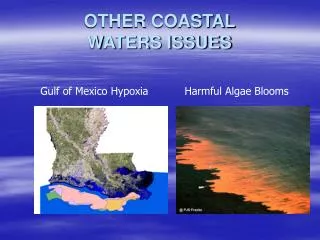
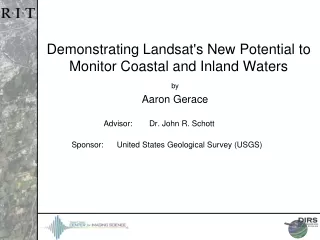
Development and calibration of an algorithm to generate Suspended Particulate Matter (SPM) maps for Belgian coastal waters using SeaWiFS, MERIS, and MODIS satellite imagery. The study includes data collection, reflectance measurements, and non-linear regression analysis to establish the relationship between SPM and reflectance. Results show correlation with in-situ SPM data, highlighting the potential for depth-average SPM production to aid SPM Transport Model. Acknowledgements to various organizations supporting the satellite image data distribution and validation efforts.

E N D
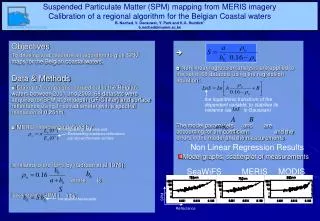
SeaWiFS MERIS MODIS SPM (mg/l) Reflectance Suspended Particulate Matter (SPM) mapping from MERIS imagery Calibration of a regional algorithm for the Belgian Coastal waters B. Nechad, V. Decauwer, Y. Park and K.G. Ruddick* b.nechad@mumm.ac.be http://www.mumm.ac.be Objectives To develop and calibrate an algorithm to give SPM maps for the Belgian coastal waters. Data & Methods ◘ During 17 campaigns carried out in the Belgian waters between 2001 and 2003, 68 datasets were acquired for SPM at 3m depth (GF/C filter) and surface reflectance using Trios radiometer with a spectral resolution of 0.25nm. ◘ MERIS reflectance defined by: is related to the IOPs by (Gordon et al 1976): where is linked to the SPM ( ) by: ◘ Non linear regression analysis are applied to the set of 68 datasets using the regression equation: The model parameters and are accounting for the coefficient and the errors in the model and the measurements the logarithmic transform of the dependent variable, to stabilise its variance (as is Gaussian) Upwelling radiance and Downwelling irradiance reflectance just above the water surface Non Linear Regression Results Model graphs, scatterplot of measurements the specific backscatter
AQUA TERRA SeaWiFS MERIS Trios M/AQUA M/TERRA Model performance SeaWiFS MERIS MODIS SPM in mg/l derived from MERIS image taken on June, 16th 2003 at 12:25 UTC SPM in mg/l derived from 2 SeaWiFS images taken on June, 16th 2003 at 11:47:30 UTC and 13:25:05 UTC SPM in mg/l derived from 2 MODIS images taken on June, 16th 2003 at 12:25 UTC and 10:45UTC Wavelengths (nm) Reflectance spectra measured by the 4 sensors at station MC16A, on the 16th June 2003
SPM (mg/l) at 0.5m, pre-ashed, GF/F SPM (mg/l) at 3m, GF/C filter • Preliminary validation Scatterplot of 6 matchup MERIS SPM data vs in situ SPM data, the correlation of these with MERIS product is negative (C=-46,47%), while it is C=79,46% for the MUMM product. • Conclusions ◘ The Red and Near IR bands avoid the signature of CDOM and yellow substance absorption. The main IOPs arise from water absorption and SPM scattering. ◘ SPM is almost linearly related to reflectance. • Perspectives ◘ More SPM data to be collected and used in the validation. ◘ An application of this study is the production of depth-average SPM to provide the SPM Transport Model with boundary conditions. The Belgian Office for Scientific, Technical and Cultural affairs (OSTC), the receiving station of Dundee University, Orbimage, the SeaWiFS and SeaDAS project teams, the Distributed Active Archive Center at GSFC, ESA and its subcontractors and the MODIS team are acknowledged for providing, distributing and supporting satellite images.