Download
1 / 1
10 likes | 108 Vues
CA. NV. GA. TX. AZ. CO. WA. FL. OR. MD. NC. VA. NJ. MA. AK. TN. IL. NY. DE. MN. HI. CT. KY. SC. MO. OH. RI. NH. NM. MI. AR. ID. UT. IN. KS. WY. LA. AL. VT. WI. OK. MS. NE. PA. MT. IA. SD. ME. WV. ND.

E N D
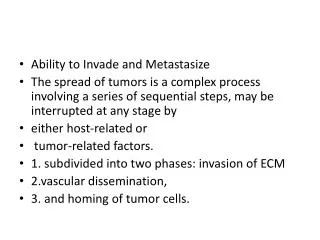
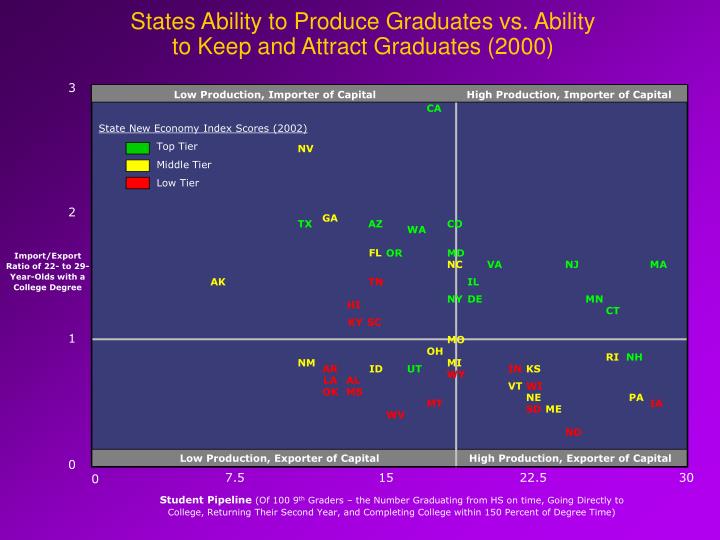
CA NV GA TX AZ CO WA FL OR MD NC VA NJ MA AK TN IL NY DE MN HI CT KY SC MO OH RI NH NM MI AR ID UT IN KS WY LA AL VT WI OK MS NE PA MT IA SD ME WV ND States Ability to Produce Graduates vs. Ability to Keep and Attract Graduates (2000) 3 Low Production, Importer of Capital High Production, Importer of Capital State New Economy Index Scores (2002) Top Tier Middle Tier Low Tier 2 Import/Export Ratio of 22- to 29-Year-Olds with a College Degree 1 Low Production, Exporter of Capital High Production, Exporter of Capital 0 7.5 15 22.5 30 0 Student Pipeline (Of 100 9th Graders – the Number Graduating from HS on time, Going Directly to College, Returning Their Second Year, and Completing College within 150 Percent of Degree Time)