Download
1 / 18
180 likes | 319 Vues
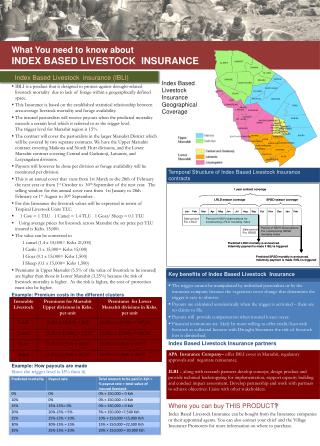
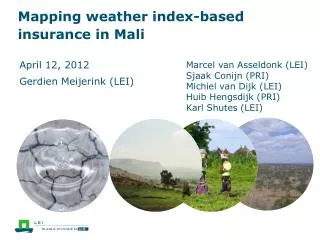
Mapping weather index-based insurance in Mali. April 12, 2012 Gerdien Meijerink (LEI). Marcel van Asseldonk (LEI) Sjaak Conijn (PRI ) Michiel van Dijk (LEI) Huib Hengsdijk (PRI) Karl Shutes (LEI). Weather Index Based Insurance (WIBI).

E N D
Mapping weather index-based insurance in Mali April 12, 2012 Gerdien Meijerink (LEI) Marcel van Asseldonk (LEI) Sjaak Conijn (PRI) Michiel van Dijk (LEI) Huib Hengsdijk (PRI) Karl Shutes (LEI)
Weather Index Based Insurance (WIBI) • WIBI is an insurance that pays out when a certain index is exceeded: • i.e. when rainfall falls below a certain threshold in a specific area, all farmers in the insurance scheme are paid Why is it so popular? • Cost-effective: no need to check crop losses at each farm • Easy to administer for a large group of farmers • Suitable for climatic risk and associated harvest losses
Weather Index Based Insurance (WIBI) Some drawbacks: • Needs good set of (historical) climate data for specific regions (not always available in Africa) • Risk must be idiosyncratic: not occurring routinely, otherwise insurance becomes too costly • However, if risk is very uncommon, farmers may not want an insurance • Crop loss should be linked to (exceptional) climatic incident such as very low rainfall, not to other risks (flooding, pests, inappropriate farm management)
Some examples • IFAD and WFP: weather index based insurance in Mali (suspended) • Wageningen UR involved in pre-feasibility research (targeting and calculating crop loss) • FARMAF: Family Agriculture Risk Management in Africa: • Zambia (Actesa-Comesa) • Tanzania • Burkina Faso (PlanetGuarantee, credit-linked 10.000 farmers) • Wageningen UR involved in evaluation of schemes
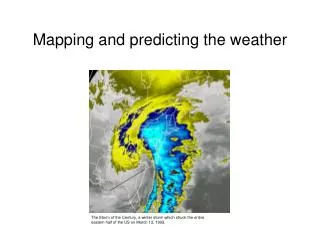
The Miracle of Mapping Or: why use spatial data? • Because insurance is based on an index, it covers a specific area, for which spatial data is probably available: • Effects of shortfall in rainfall can be measured by remote sensing • Available spatial data (on soils etc) can be used to calculate crop yields / losses with different levels of rainfall • Available socio-economic data can be used for targeting • Lowers costs of WIBI schemes
Example: WIBI in Mali • Calculate maize yields with different rainfall • Use of crop growth model (LINPAC) • Input into model : spatial soil data, water data (irrigation) and land use data of Mali • Analyse links between maize yields and socio-economic factors • Use of spatial econometric methods • Input: spatial data on maize yields, fertiliser use, market access and population density
Percentage of years with low yield, here defined as < 40% of the 30-years average rain fed yield per grid cell used for growing maize in Mali around the year 2000
Spatial risk distribution for maize production (based on the 40% threshold) • Area suitable for weather index-based insurance • E.g. only those maize areas that face a 10–30% probability that yields will be 40% below the average yield in a grid cell (combination of the probability classes 10-20 and 20-30)
Maize area (ha) per year with a yield of 40% below the average grid cell yield. The red line indicates the total maximum maize area, here selected by probability classes 10-20 and 20-30 from previous figure
Yield gap: difference between potential yield and actual yield
Thank you P.S. there is much more data for Africa!