Download
1 / 22
220 likes | 345 Vues
Tariff strategies and the Internet. Dr Tim Kelly (ITU), Seminar on tariff strategies for competitive environments, ALTTC, Ghaziabad, 20-22 July 1999.

E N D
Tariff strategies and the Internet Dr Tim Kelly (ITU), Seminar on tariff strategies for competitive environments,ALTTC, Ghaziabad, 20-22 July 1999 The views expressed in this paper are those of the author and do not necessarily reflect the opinions of the ITU or its Membership. Dr Kelly can be contacted by e-mail at Tim.Kelly@itu.int
“We started out running the Net on top of the phone system, and we’ll end up with telephony running over the Net.” Eric Schmidt, CEO, Novell, Quoted in Wired, August 1997 The Economist May 2nd 1998
Agenda • The phenomenal growth of the Internet • Internet economics • Internet telephony • Pricing the Internet: What makes it different? • Retail pricing • Pricing of local calls • Wholesale pricing • Vulnerability of telephone companies to competition from the Internet • Implications of the Internet for developing countries
Internet hosts (million) and growth rates, 1990-1998 50 43.5 40 29.7 30 20 16.1 9.4 10 4.7 2.3 1.3 0.7 0.4 0 90 91 92 93 94 95 96 97 98 Source: ITU “World Telecommunication Development Report, 1998”, Network Wizards.
Distribution of Internet hosts, January 1998 Australia, Japan & New Zealand 7.0% Developing Canada & Asia-Pacific Other US 2.9% 4.6% 64.1% Europe, 24.3% LAC* 1.2% Africa 0.5% Source: ITU “Challenges to the Network: Internet for development, 1999”.
Internet host density by region, January 1999, Per 10’000 inhabitants 363.1 362.1 132.9 9.1 2.4 Africa Asia Europe Americas Oceania Source: ITU “Challenges to the Network: Internet for Development, 1999”, Network Wizards.
Internet traffic overtaking int’l voice traffic Internet traffic overtaking int’l voice traffic Hongkong-China, monthly minutes of use, Hongkong-China, monthly minutes of use, April 1998-March 1999 April 1998-March 1999 800 Dial-up Internet 600 (via PSTN) 400 International voice 200 (incoming and outgoing) 0 4/98 6/98 8/98 10/98 12/98 2/99 Source: ITU, TeleGeography Inc., “Direction of Traffic, 1999”, OFTA. Note: Excludes Internet access from leased lines.
Internet Internet commerce, infrastructure, 31% 35% Internet Internet intermediaries, applications, 18% 17% How big is the Internet economy? How big is the Internet economy? Estimated value of US Internet economy, 1998 Estimated value of US Internet economy, 1998 US Internet economy, US$301.4 bn Source: University of Texas/Cisco, www.internetindicators.com
Internet Economics: Five factors that make the Internet different 1. Packet-switched network architecture • Connection-less not connection-oriented 2. Pricing independent of distance & duration • Average message covers 15 or more “hops” 3. Peering arrangements, not settlements • Based on a full-circuit regime, not on half-circuits 4. Traffic flows highly asymmetric • Dominant flow is to terminal that initiates a session (though this is changing ….) 5. The United States sets the rules! • There is no “Internet Telecommunication Union”
Internet Phone Gateway Computer Phone Gateway Computer Internet Phone Gateway Computer Public Switch Telephone Internet Phone Gateway Computer Phone Gateway Computer Telephone Public Switch Telephone Internet telephony:Different modes • Computer to computerSince 1994 • Conversation between two similarly equipped computer users via Internet • Computer to telephone Since 1996 • Internet user interconnecting with Public Telephone Network via an intermediaryservice provider (e.g., call-back company) or a service provider’s Website • Telephone to telephone Since 1997 • Telephone carrier routes telephone or fax message via a data network (Internet, frame relay) rather than viathe Public Telephone Network
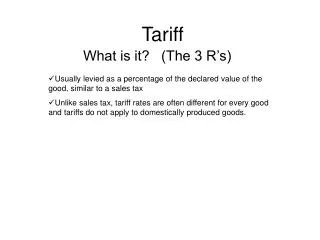
Which would you choose?Price per minute of a 3 minute international telephone/fax call from US (in US$) AT&T basic AT&T One Internet UK 3.27 0.36 0.60 Germany 3.75 1.05 0.96 Australia 4.53 1.35 1.02 Japan 4.35 1.44 1.29 Korea (Rep) 5.46 1.77 1.17 Source: Adapted from data in TeleGeography 1997/98. Original source of AT&T tariff data is Tarifica. AT&T basic refers to the peak rate basic offering. “AT&T One” refers to the AT&T One Rate for which a US$3 per month fee is payable. Internet Telephony tariff data is sourced from Global Exchange Carrier and is relevant for October 1997.
Internet charges, global average 1998 Total monthly cost = US$94 ISP charges Telephone 24% charges 45% PC price 31% Note: PC charges depreciated over 3 years.Source: ITU “Challenges to the Network: Internet for development, 1999”.
Asia-Pacific, comparative prices,In US$, based on 20 hours off-peak use per month Malaysia ISP charge Indonesia Local calls India Line rental Singapore Hongkong Philippines Thailand Japan 0 20 40 60 80 Source: ITU “Challenges to the Network: Internet for development, 1999”.
OECD, Internet monthly As % of GDP access charge, US$ per capita 14.8% Mexico 94 65 12.8% Turkey 50 Japan 2.6% 33 Finland 2.2% USA 29 1.2% 24 Australia 1.5% The relative cost of services The relative cost of services Source: ITU 1999 “Challenges to the Network: Internet for Development”
Internet, price and service trends: Retail market • Until recently, flat-rate pricing dominant • All you can eat for US$19.95 • Now, “Free Internet” becoming highly popular • Price of Internet access cross-subsidised by cost of local calls plus revenue drawn from advertising • Towards lower service quality • “Best efforts” service delivery at lowest price • Cross-promotion of Internet and other services • “Free PC” with three year’s ISP subscription • Tendency towards industry concentration • AOL’s subscriber base > next ten ISPs added together
What makes the Internet so cheap? • Network externalities • Interconnection of networks shares costs and builds economies of scale • Technical efficiency • Packet switching, routing, statistical multiplexing • Piggybacking on Public Telephone Network • Much of network investment already amortised • Telephone network has built-in cross subsidies • Competitive network and service provision • Public policy subsidies (esp. in US) • No settlements between operators
$19.95 per month subscription $7.50-$10.50 Wholesale PoP Access $2.00 - $3.00 Customer Care $3.50-$7.50 margin per customer $3.00 amortized customer marketing Where does the money go? Typical Internet Service Provider cash-flow Source: Adapted from Paul Stapleton, ISP$ Market Report, Boardwatch Magazine.
When is a local call not a local call? • Internet usage has grown fastest in countries which permit “free” or untimed local calls (e.g., USA, Canada, HK, Australia) • But, PTOs claim that Internet users and ISPs are “free-riding” the network • longer average sessions • asymmetric traffic flows • In countries where local calls are metered, users complain that Internet is too expensive • “Strikes” of Internet users in Germany, France • Rapid take-off of “Free Internet” • Free monthly Internet access in return for loyalty to dial-up local loop service provider
Internet Service Providers do not pay usage-based access charges: • US access charge for telephony = US$0.02 per min • US access charge for Internet = US$0.0009 per min • Internet users have no incentive to terminate or shorten calls: • average length of telephony call = 5-10 mins • average length of Internet call = 20-40 mins Tariff policy Usage patterns The Regulators’ dilemma Introduce usage-based access charges Do nothing Risk political meltdown Risk local loop meltdown
Settlements-based traffic Settlements-based traffic PTO = Public Telecommunications Operator Delivers traffic PTO B PTO A Pays settlement fees Retains Collects Terminates Collects revenues revenues traffic traffic User 1 User 2 User 3 User 1 User 2 User 3 For accounting rate traffic, a direct bilateral relationship is established between the origin and termination operators. Intermediate transit operators are compensated from the accounting rate which is usually split 50:50. PTO B retains net settlement. ……...
May collect Terminates traffic local call fee Internet telephony traffic Internet telephony traffic IXP = Internet Internet Exchange Point IXP X IXP Y ISP = Internet Peering Service Provider ISP A pays for ISP B pays for transit capacity transit capacity ISP B ISP A Collects Collects revenues traffic User 1 User 2 User 3 User 1 User 2 User 3
Settlements and sender-keeps-all: What’s the advantage? • Settlement-payment traffic • Transfers revenue from core to periphery of network • Promotes “organic” network growth • BUT, where traffic is unbalanced, leads to big deficits (e.g., US$5.7 bn deficit in US, in 1996) • Sender-keeps-all traffic • No revenue transfers • Promotes “spontaneous” network growth • BUT, no incentive to carry traffic being transited or terminated Note: Where traffic flows are in balance, there is no practical difference