Download
1 / 53
530 likes | 723 Vues
Economics 311 Money and Income. Chapter 3-The Behavior of Households with Markets for Commodities and Credit. Department of Economics College of Business and Economics California State University-Northridge Professor Kenneth Ng. Wednesday, November 19, 2014. Expanding the Model.

E N D
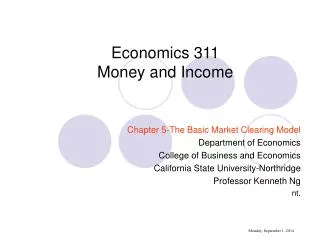
Economics 311Money and Income Chapter 3-The Behavior of Households with Markets for Commodities and Credit. Department of Economics College of Business and Economics California State University-Northridge Professor Kenneth Ng Wednesday, November 19, 2014
Expanding the Model • In the previous chapter, we examined the work/leisure production decision of person in isolation (The Robinson Crusoe Economy). • In this chapter, we want to add in additional elements of the real world. • Commodities Market. • Instead of a person consuming everything he produces, allow households to produce goods for sale to others. • Because a person is now exchanging in the market, there is money. • Credit Market. • Allow households to save and borrow. • In our simplified model, there are no financial intermediaries (banks). Households borrow and save by buying and selling bonds in financial markets. • The existence of commodities and credit markets allows the household to disengage the production and consumption decision. • It is possible to consume more than your produce in a given time period. • There is also a reward to producing more than your consume in a given time period.
Commodities Market • Commodities Market: where a person can buy and sell commodities- • Add Money analogous to a paper currency.
Commodities Market (2) • P is the number of dollars received for each unit of the good. • Dividing by the price level converts nominal to real. For instance:
Commodities Market (3) • The household chooses y (the amount produced). • Analyze decision using production function graph from previous chapter. • The house hold also chooses c (consumption). • The difference between production and consumption determines whether the household is a net saver or borrower in a given time period.
Credit Market • Credit Market: where households can borrow and lend. • In our simplified model there are no financial intermediaries (banks) that facilitate borrowing and lending. • Instead, households that want to borrow or lend money do so by buying and selling bonds in financial markets. • How Does a Bond Work? • A bond is piece of paper which says that at a future date (maturity) the issuer of the bond will pay a certain amount (face value). • The bond is sold at a discount to it’s face value today. • The difference between the price at which the bond is sold and it’s face value represents interest the borrower is paying the lender for the use of the money over time. • Sell a bond--are you borrowing or lending? • Buy a bond are you borrowing or lending? • What are the face value, the purchase price, and the yield or interest rate of a bond. • Example: A bond with a face value of $110, a maturity of one year, and a current price of $100. Can solve using the formula:
Credit Market (2) Bond of Kenneth Ng In one year, I will give you $110 • Consider the bond pictured above. • If I sell this bond—am I borrowing or lending? • borrowing • If I buy this bond—am I borrowing or lending? • lending • If I am holding bonds, what am I doing? • lending • If my holdings of bonds falls, what is happening? • Reducing my gross savings. • What are the face value, the purchase price, and the yield or interest rate of a bond.
Bond Example. • Example: A bond with a face value of $110, a maturity of one year, and a current price of $100. Can solve using the formula:
Bond Example (2). • Suppose interest rates increase to 20%. What would happen to the price or present value of this bond? • Its’ price or present value would fall to $91.67. • When the interest rate increases, what happens to the price or present value of bonds? Why? • An increase in interest rates will cause a decrease in the price of bonds. • Because the amount the owner of the bond will receive in the future (face value) is fixed, the higher the interest rate, the less people will pay for the bond today. • Bond notation: Assume all bonds have a principle of $1, an interest rate of R, and a maturity of 1 year. Future Value is 1+R.
Present Values. • If the interest rate is 10%, the present value of $110 received one year from now is $100. • If we had $100 today we could put the $100 in the bank at 10% interest and in one year we would have $110. • If we went to a bank and borrowed the maximum amount of money subject to the condition that we had to repay the money borrowed plus interest in one year with $110, we could borrow $100 at 10%. • This is what the present value of future payment means, ie at a given interest rate you could convert the present value into the future value or the future value into the present value at a given interest rate. • If the interest rate is 20%, the present value of $110 received one year from now is $91.67. • How much would we need to deposit into a bank today at 20% in order to have $110 in one year? • Answer: $91.67 • If we had $110 in one year to pay back principle and interest, how much could we borrow today at 20%? • Answer: $91.67
Saving • Saving is defined as the net change in a households asset position: • When bt-bt-1 is positive then the household has increased its’ bond holdings and is a net saver for that period. • When bt-bt-1 is negative, then the household has decreased its’ bond holdings and is a net borrower for that period.
One Period Budget Constraint of the Household • Budget constraint of the household says that the consumption plus bond purchases plus money holdings must equal production, plus money in previous period plus principal and interest earned on bonds in the previous period. • Sources of funds • Income from working • Principle and interest from savings (bond holdings). • Cash balances • Uses of funds • Consumption • Savings • Cash balances
Nominal Savings of the Household. • Nominal savings by the household can be derived by rearranging budget constraint of the household: • The nominal savings of a household equals the income from producing and selling output plus interest receipts less consumption expenditures.
Inter temporal Budget Constraint. • Assuming money holdings constant from period to period can simplify the budget constraint over two periods to: • Which says, the source of funds (left side) must equal the uses of funds (right side) or this equation says that the present value of output plus savings has to equal the present value of consumption plus future savings.
Inter temporal Budget Constraint. • Consider the term: • This is the present value of income earned in one period in the future. • It is the amount of money that you could borrow today if you had to pay the money borrowed plus interest with the money earned in period 2.
Inter temporal Budget Constraint. • Consider the term: • This is the maximum amount of money that a person could get today if he was willing to borrow against all future income. • It is a measure, in today’s dollars, of the person’s income today and in all future periods.
Clarifying Example 1 • Suppose you had $1000 in savings account, earned $8000 by working and had $1000 in cash balances. If the interest rate were 10%, could you spend $5000 today and $5500 next year. • Answer yes. By saving or lending your $5000 in excess funds at 10% you would have $5500 to spend next year.
Clarifying Example 2 • Suppose you were going to earn $22,000 next year. Could you spend $20,000 this year if you could borrow at 10%? • Answer yes: If you borrowed $20,000 today, you could borrow $20,000 and pay it back plus interest with the $22,000 you earn next year. • How much could you borrow and pay back with a given amount of money next year is given by the formula:
Clarifying Example 3 • Suppose you expected to earn $50,000 next year and $40,000 this year, what is the most you could spend this year if you were willing to spend nothing next year.
Permanent Income • If we just call the right side of the equation x (present value of lifetime income), the equation becomes: • X = permanent income = present value of income = the maximum amount of money a household could have today if they borrowed against all future income at prevailing rates. Ignoring money and savings the budget constraint for two periods will be: • Permanent income is a measure of a person’s lifetime earnings and incorporates expectations about future earnings.
Example 1 • A person who earns $100,000 today and $100,000 next year. What is the present value of his income if the market interest rate is 6%?
Example 2 • Suppose a person was earning $100,000 per year and the interest rate is 6%. • Would a person prefer a $25 000 pay increase today with a $20,000 pay decrease in one year or a $50,000 pay increase in a year and a $40,000 pay decrease now? • What would happen in the interest rate decreased. Explain.
The Inter temporal Budget Constraint. • The inter temporal budget constraint shows the combinations of consumption that a household can sustaingiven their stream of income. • In the graph, the blue shows the combinations of consumption that can be sustained by earning $10,000 today and $10,000 in one period. • If the interest rate is 10% what are the horizontal and vertical intercepts.
The Inter temporal Budget Constraint. • If the person put the $10,000 you earn today in the bank at 10%, you could get $11,000 in one year. • If you borrowed $9,090.91 at 10%, you could pay back the principle and interest in one year with $10,000 • The position of the inter –temporal budget constraint represents X or permanent income.
Slope of the Inter temporal Budget Constraint. • The slope of the inter temporal budget constraint is 1+R. • If the person gives up $1 today (run) he can get 1+R in one year (rise). • The higher the interest rate the steeper the inter temporal budget constraint.
Shifts in the inter temporal budget constraint. • Wealth effects: A Parallel shift in inter temporal budget line or an increase in x-permanent income. • This can be caused by either an increase in today’s income or an expected increase in future income. • In the graph, future income has increased from $10,000 to $12,000. • This increase in future income makes more combinations of present and future consumption possible.
Shifts in the inter temporal budget constraint. • Substitution Effects: Change in interest rates: Change in slope of intertemporal budget line. • If interest rates were to rise, the cost of consumption next period would fall because each dollar of consumption foregone this period translates into more dollars of consumption next period-inter-temporal substitution effect.
Shifts in the inter temporal budget constraint. • Does the graph depict a decrease or increase in interest rates. • What would the vertical and horizontal intercepts be if the interest rate increased from 10% to 20%? • $22,000 and 18.333.33
Indifference curve between consumption now and later. • The IC shows combinations of consumption now and later between which the household in indifferent. • If given a choice between the combinations on an IC, the person wouldn’t care which he receives. • Slope of IC is the MRS between consumption now vs. consumption later = what is the least future consumption you would have to give a person to get him to give up one unit of current consumption. • Position and shape of the IC represents a person's preferences between present and future consumption.
Future Consumption Example 1: What happens if a person was diagnosed with AIDS? Present consumption would become more valuable. The slope of the IC would become steeper. Red to blue. 0 Present Consumption
Future Consumption Choices of Work Effort over Time. The person chooses work effort in the present and the future (y1 and y2). Given the interest rate and his income in the present and future, the combinations of future and present consumption that are attainable are given by the intertemporal budget constraint. y2 0 y1 Present Consumption
Future Consumption Choices of Work Effort over Time. Given his intertemporal budget constraint, the individual chooses combination of present and future consumption that makes him happiest. In the graph is the person a net borrower or lender in the present? Net lender. y2 0 y1 Present Consumption
Future Consumption Adjustment to a change in interest rates. Does the blue line represent an increase of decrease in interest rates? Increase. y2 0 y1 Present Consumption
Future Consumption Example 2: What happens if a person finds out his wife has terminal cancer? Given the rotation of the intertemporal budget constraint, the person chooses the combination of present and future consumption that makes him happiest. How has the person shifted consumption over time? Moved consumption from the present to the future. y2 0 y1 Present Consumption
Future Consumption Example 2: What happens if a person finds out his wife has terminal cancer? What further effect will the adjustment of consumption over time have on bond prices and interest rates? Everyone is trying to buy bonds driving their price up and interest rates down. y2 0 y1 Present Consumption
The Role of expectations on consumption patterns over time, bond prices, and interest rates. • Suppose a person expected his income to increase in the future. • What effect would this have on current consumption? • What effect would it have on current borrowing or lending? • What effect would this have on bond prices and interest rates?
Future Consumption Choices of Work Effort over Time. Given his intertemporal budget constraint, the individual chooses combination of present and future consumption that makes him happiest. In the graph is the person a net borrower or lender in the present? Net lender. y2 0 y1 Present Consumption
Inter-temporal adjustments in the pattern of work--the role of expectations on consumption and work patterns over time, bond prices, and interest rates. • What role do expectations play in determining interest rates and the pattern of work over time? • Suppose a person experienced a temporary upward shift in his production function. • What effect would this have on current and future consumption and work effort? • What effect would it have on current borrowing or lending? • What effect would this have on bond prices and interest rates? • Suppose the same upward shift in the production function occurred but it was expected to be permanent. • How would the answers to the above questions change? • Can expectations about the future affect current behavior (work effort, unemployment, and GDP)?
Consider a temporary improvement in production function. • The graphs below depict a households choice of work effort over time. • The household works l1 today and l2 in the future and produces y1 today and y2 in the future. • Assume that everything is the same in now and in the future. The Permanent Income Hypothesis says that people like even consumption flows over time so the household simply works and produces the same amount now and in the future and consumes what ever it produces each period. • Suppose now there was a temporary improvement in the the production function. • What could cause such an improvement? How would this be depicted on the graphs? Now Future y1 y2 l1 l2
Consider a temporary improvement in production function. The improvement in the current production function is depicted as the red dotted line. Notice that only the current production function changes. The temporary improvement in the production function will cause a change in work effort today and in the future because the wage rate is higher today but lower in the future. The person could have the same permanent incomeworking fewer total hours by working more now when the wage is higher, work less in the future when the wage is lower then saving some of the extra income he earns today and consuming his savings plus interest in the future. Working less hours he could support the same pattern of consumption over time. Now Future y1A y1 y2 l1 l1A l2
Consider a temporary improvement in production function. The change in future work effort is depicted as the movement from l 2 to l 2A in the graph. The person increases current work effort and reduce future work effort. The temporary improvement in the production function will increase current GDP and employment. Now Future y1A y1 y2 y2A l1 l1A l2A l2
Future Consumption The effect of a temporary improvement in the production function on the pattern of consumption, bond prices, and interest rates. The household starts off at point A on the black inter-temporal budget constraint. With the rise in current wage rates, the household adjusts by increasing work effort today and reducing work effort in the future. There pattern of earnings after the adjustment is represented by point B. The household now evens out consumption by saving money today and spending the money invested plus interest in the future. If all households did this the price of bonds would rise and interest rates would fall causing the inter-temporal budget constraint to rotate (blue line). A C2 = y2 B y2A 0 C1 =y1 y1A Present Consumption
Now consider a permanent improvement in production function. • The graphs below depict a households choice of work effort over time. • The household works l1 today and l2 in the future and produces y1 today and y2 in the future. • Assume that everything is the same in now and in the future. The Permanent Income Hypothesis says that people like even consumption flows over time so the household simply works and produces the same amount now and in the future and consumes what ever it produces each period. • Suppose now household expected a permanent improvement in the the production function. • What could cause such an improvement? How would this be depicted on the graphs? Now Future y1 y2 l1 l2
B Consider a permanent improvement in production function. The improvement in the current production function is depicted as the red dotted line. Notice that only the current production function changes. The movement to point A is the change in labor caused if the improvement in the production function is expected to be temporary. Will the change in current work effort be the same if the improvement in the production function is expected to be permanent? Now Future y1A A y1 y2 l1 l1A l2
B B Consider a permanent improvement in production function. Because the production function is expected to be the same now and in the future, work effort will increase now and in the future. What happen to the net borrowing of the household? Now Future y1A y1B y2B y1 y2 l1 l1A l2 l2B l1B
Future Consumption The effect of a temporary improvement in the production function on the pattern of consumption, bond prices, and interest rates. The household starts off at point A on the black inter-temporal budget constraint. With the rise in current and future wage rates, the household adjusts by increasing work effort today and in the future. There pattern of earnings after the adjustment is represented by point B. Because things will be the same now and in the future, the household will not try to shift income over time by borrowing or lending. There will be no effect in the bond market. B y2B A C2 = y2 0 C1 =y1 y1B Present Consumption
Temporary vs. Permanent Changes in the Production Function. • When analyzing the effects of a change in the production function expectations matter. The same change in the production function today can have vastly different effects depending upon whether the change is expected to be permanent or temporary. • Questions to answer: • Which will have a greater effect on current GDP, unemployment, and work effort—a change in the production function that is expected to be temporary or permanent? Explain. • Temporary. • Which will have a greater effect on bond prices and interest rates-a change in the production function that is expected to be temporary or permanent? Explain. • Temporary.
Application: Getting a tax cut through congress. • Because expectations matter and nobody really knows what is going to happen in the future, household’s expectations can be manipulated to achieve certain goals. • Suppose you are a newly elected president ala George W. Bush that wants to persuade Congress to pass legislation that would lower marginal tax rates. • Would it be better to argue for a reduction in tax rates larger than what you wanted and negotiate down or argue for a smaller than desired reduction in tax rates and negotiate up? • Explain.
Step one: Announce that you are going to pursue a large cut in marginal rates that will take effect some time in the future. What effect will an expected future improvement in the production function have on current work effort? If households decide that there is a good chance that you will be successful then households will expect future wages to higher than current wages. How will the expected future increase in wage rates effect current GDP and employment? They will respond to this by lowering current work effort and plan to increase future work effort. Now Future y2A y1 y2 y1A l1A l1 l2 l2A
Future Consumption What effect will the expected future improvement in the production function have on the bond market, stock market, and interest rates? The household starts off at point A on the black inter-temporal budget constraint. With the expected rise in future wage rates, the household adjusts by decreasing work effort today and increasing work effort in the future. There pattern of earnings after the adjustment is represented by point B. The household now evens out consumption by borrowing money today and paying back the money borrowed plus interest in the future. If all households did this the price of bonds would fall and interest rates would rise causing the inter-temporal budget constraint to rotate (blue line). Rising interest rate would cause stock prices to fall. B y1A A C2 = y2 0 y2A C1 =y1 Present Consumption