AUTOMOBILE CATEGORY
160 likes | 281 Vues
AUTOMOBILE CATEGORY. Most Trusted Brand. Survey Report. February 2009 Wave. Background. Brands’ income comes from the customers-so, brands must provide what they think is of value to the customers. It sounds obvious, yet very few brands do it well.

AUTOMOBILE CATEGORY
E N D
Presentation Transcript
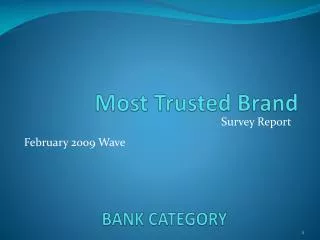
AUTOMOBILE CATEGORY Most Trusted Brand Survey Report February 2009 Wave
Background • Brands’ income comes from the customers-so, brands must provide what they think is of value to the customers. It sounds obvious, yet very few brands do it well. • The goal of branding is to build, maintain, and enhance relationship between brands and consumers. Relationship building is a powerful means of creating and sustaining competitive advantage. Sustainable relationship involves trust as its main ingredient. Therefore, brands must build a relationship of trust with their customers. Trust as a critical element in relationship is the focus of this survey. • The Most Trusted Brand survey is an attempt to track the strength of brands relationships with their consumers. It is expected that results from the tracking would enable an environment of continual learning, continual improvement and innovation for the brand owners.
It is expected that it would stimulate a new way to think- seeing the customer’s input in this survey as a gift, and new knowledge that can be used to better brand planning and achieve competitive advantage. The results would serve as a reminder for the brand owners to build on-going relationships by keeping their promises and building trust. • As a contribution to strong brand management initiatives in Nigeria, BrandHEALTH commences this study as a means of providing a cost effective, reliable, quick, economic and continuous source of primary data on how brands bond with the consumers.
Research Objectives • The study has only one objective: • To identify brands that best bond with the consumers.
Research Methodology • Respondents were interviewed face to face in-home using fully structured questionnaires. Multi-stage sampling method was used in selecting respondents. • 1000 respondents were interviewed in various parts of Lagos. 560 of the sample were males while the balance 440 respondents were females. The study also comprised of respondents aged 18 to 24 years (29%), 25 to 34 years(43%),35 to 45(19%) and 46 years and above(10%). In terms of social class, 17% of the respondents were consumers in the upper income class, 42% in the middle income class and 41 in the lower income class. • The fieldwork for February wave started on the 5th of February and ended on the 21st of February, 2009.
In each product category, the respondents were asked five questions relating to trust. They were asked to associate the statements read to them with brands (a single brand per statement). No brand name was mentioned to the consumers. Respondents named brands spontaneously. The aggregate scores for the five statements were then computed to determine the most trusted brand for each product category.
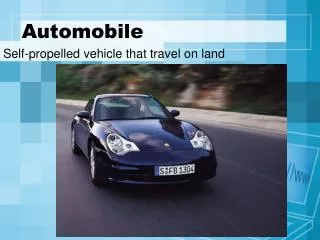
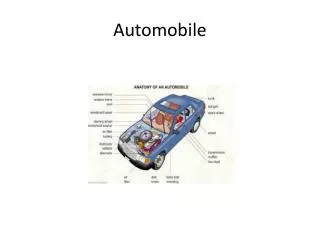
Automobile • Overall • The most trusted brand survey is an attempt to identify on continuous basis the brand of car that best bond with the Nigeria consumers. It is a bi-monthly study. • This volume is February 2009 edition. The study was conducted in Lagos market only with 1000 respondents participating. • One interesting thing about the category is that both car owners and potential owners were able to contribute in the survey. • However, 16% that is, 164 out of 1000 respondents did not know what to say about the category when contacted. • The study required that each respondent associates a statement with a single brand unaided. Five statements relating to the amount of trust they have on the brands were read out to the respondents. They were expected to mention a brand that the statements best applied. • Based on the association, results were computed. And from the results, Toyota was adjudged the most trusted brand of car in the market by 26% of the respondents • Honda occupied the second position with 17% vote
Others mentioned were: • BMW 7% • Mercedes Benz 4% • Nissan 3% • Peugeot 2% • Volkswagen 2% • KIA 2% • Gender • The difference in the choice of the most trusted brands by gender was somewhat negligible. However, more female voted for KIA • Age • Respondent aged 46yrs and above vote more for Toyota and Honda • Social Class • Most votes came from the upper income class for both Toyota and Honda
CARS CATEGORY BMW, 7% Toyota, 26% Volkswagen, 2% Others, 4% 4% Mercedes benz, Peugeot, 2% Don’t Know, 19% Nissan, 3% KIA, 2% Honda, 17% None, 15% Base I Obtain what I look for in it 1000 I feel most confident in 1000 Would be honest in attending to my needs 1000 Would make any effort to satisfy me 1000 Would never disappoint me 1000 Toyota 26% 26% 26% 27% 26% Honda 17% 18% 17% 17% 17% BMW 8% 7% 7% 8% 7% Mercedes Benz 5% 5% 5% 1% 5% Nissan 3% 3% 3% 3% 3% KIA 2% 2% 2% 2% 2% Peugeot 2% 2% 2% 2% 2% Volkswagen 1% 1% 1% 5% 1% Others 3% 8% 4% 2% 4% None 6% 27% 6% 27% 6% Don’t Know 27% 6% 27% 6% 27%
I OBTAIN WHAT I LOOK FOR IN CARS Don’t Know, 27% BMW, 8% None, 6% 5% Toyota, 26% Mercedes benz, Peugeot, 2% Volkswagen, 1% Others, 3% Nissan, 3% KIA, 2% Honda, 17% Male Female 18-24 25-34 35-44 45+ AB C D Base 560 440 285 429 190 96 172 418 410 Toyota 28% 24% 21% 28% 26% 32% 42% 25% 20% Honda 18% 16% 14% 21% 16% 13% 27% 15% 16% BMW 8% 8% 8% 8% 8% 4% 7% 8% 8% Mercedes Benz 5% 5% 2% 6% 5% 9% 7% 5% 4% Nissan 4% 1% 5% 2% 2% 2% 2% 3% 2% KIA 1% 4% 4% 2% 3% 1% 2% 4% 1% Peugeot 2% 1% 1% 1% 2% 4% 2% 2% 2% Volkswagen 2% 2% 2% 1% 1% 1% Others 3% 3% 4% 5% 4% 7% 5% 1% 3% None 4% 8% 8% 5% 8% 1% 4% 10% Don’t Know 25% 30% 33% 25% 24% 28% 4% 32% 33%
I FEEL MOST CONFIDENT IN Don’t Know, 27% BMW, 7% None, 6% 5% Toyota, 26% Mercedes benz, Peugeot, 2% Volkswagen, 1% Others, 3% Honda, 18% Nissan, 3% KIA, 2% Male Female 18-24 25-34 35-44 45+ AB C D Base 560 440 285 429 190 96 172 418 410 Toyota 28% 24% 21% 28% 26% 32% 40% 25% 21% Honda 19% 17% 14% 21% 17% 14% 30% 15% 16% BMW 8% 7% 8% 7% 8% 3% 6% 8% 7% Mercedes Benz 4% 5% 2% 5% 4% 8% 7% 4% 4% Nissan 4% 1% 5% 2% 2% 2% 2% 3% 2% KIA 1% 4% 4% 2% 2% 1% 2% 4% 1% Peugeot 2% 1% 1% 1% 2% 4% 2% 2% 2% Volkswagen 2% 2% 2% 1% 1% 1% Others 3% 2% 4% 2% 5% 8% 5% 2% 3% None 4% 8% 8% 5% 8% 1% 4% 10% Don’t Know 25% 31% 33% 25% 24% 28% 4% 32% 33%
BANK CATEGORY Don’t Know, 5% First Bank, 13% UBA, 13% GTB, 13% Skye Bank, 3% Oceanic, 12% Diamond Bank, 2% ECOBank, 2% Others, 10% Intercontinental , None, 2% 9% Bank PHB, 8% Zenith, 7% Base I Obtain what I look for in it 1000 I feel most confident in 1000 Would be honest in attending to my needs 1000 Would make any effort to satisfy me 1000 Would never disappoint me 1000 First Bank 14% 13% 13% 13% 13% GTB 13% 13% 13% 13% 13% UBA 13% 13% 13% 13% 13% Oceanic 12% 13% 12% 13% 13% Intercontinental 9% 10% 10% 9% 9% Bank PHB 8% 8% 8% 9% 8% Zenith 7% 7% 7% 7% 7% Skye Bank 3% 3% 3% 3% 3% Diamond Bank 2% 2% 2% 2% 2% ECOBank 2% 2% 2% 2% 2% Others 10% 9% 10% 9% 10% None 2% 2% 2% 2% 2% Don’t Know 5% 5% 5% 5% 5%
WOULD BE HONEST & SINCERE IN ADDRESSING MY NEEDS Don’t Know, 27% BMW, 7% None, 6% 5% Toyota, 26% Mercedes benz, Others, 4% Peugeot, 2% Volkswagen, 1% Nissan, 3% KIA, 2% Honda, 17% Male Female 18-24 25-34 35-44 45+ AB C D Base 560 440 285 429 190 96 172 418 410 Toyota 27% 25% 21% 29% 24% 34% 40% 25% 22% Honda 19% 15% 14% 21% 17% 11% 27% 15% 15% BMW 8% 7% 8% 7% 8% 4% 7% 8% 7% Mercedes Benz 4% 5% 2% 5% 4% 9% 6% 5% 4% Nissan 4% 1% 5% 2% 2% 2% 3% 3% 2% KIA 1% 4% 4% 2% 3% 1% 2% 4% 1% Peugeot 2% 1% 1% 1% 3% 3% 2% 2% 1% Volkswagen 2% 2% 2% 1% 1% 1% Others 4% 3% 4% 1% 5% 8% 7% 1% 4% None 4% 8% 8% 5% 8% 1% 4% 10% Don’t Know 25% 31% 33% 25% 24% 28% 4% 32% 33%
WOULD MAKE ANY EFFORT TO SATISFY ME Don’t Know, 27% BMW, 8% Toyota, 27% None, 6% 5% Mercedes benz, Peugeot, 2% Volkswagen, 1% Others, 3% Nissan, 3% KIA, 2% Honda, 17% Male Female 18-24 25-34 35-44 45+ AB C D Base 560 440 285 429 190 96 172 418 410 Toyota 28% 24% 21% 29% 26% 34% 41% 25% 22% Honda 18% 16% 14% 19% 18% 11% 27% 15% 15% BMW 8% 7% 8% 8% 8% 3% 8% 8% 7% Mercedes Benz 4% 5% 2% 5% 4% 9% 6% 4% 4% Nissan 4% 1% 5% 2% 2% 2% 3% 3% 2% KIA 1% 4% 4% 2% 2% 1% 2% 4% 1% Peugeot 2% 1% 1% 1% 2% 3% 2% 2% 2% Volkswagen 2% 2% 2% 1% 1% 1% Others 4% 3% 4% 2% 4% 9% 5% 3% 3% None 4% 8% 8% 5% 8% 1% 4% 10% Don’t Know 25% 31% 33% 25% 24% 28% 4% 32% 33%
WOULD NEVER DISAPPOINT ME Don’t Know, 27% BMW, 7% None, 6% 5% Toyota, 26% Mercedes benz, Others, 4% Peugeot, 2% Volkswagen, 1% Nissan, 3% KIA, 2% Honda, 17% Male Female 18-24 25-34 35-44 45+ AB C D Base 560 440 285 429 190 96 172 418 410 Toyota 28% 24% 21% 28% 27% 32% 39% 26% 22% Honda 17% 17% 14% 21% 16% 11% 27% 15% 15% BMW 8% 7% 8% 8% 8% 3% 8% 7% 7% Mercedes Benz 4% 5% 2% 5% 4% 9% 6% 5% 4% Nissan 4% 1% 5% 2% 2% 2% 2% 3% 2% KIA 1% 4% 3% 2% 2% 2% 3% 3% 1% Peugeot 2% 1% 1% 1% 2% 3% 2% 2% 2% Volkswagen 2% 2% 2% 1% 1% 1% Others 4% 3% 5% 1% 5% 10% 7% 2% 3% None 5% 8% 8% 5% 8% 1% 4% 10% Don’t Know 25% 31% 33% 25% 24% 28% 4% 32% 33%