Download

1 / 10
100 likes | 284 Vues
Defining Metrics to Measure Progress of Fellows at the Ph.D. Level: An AGEP Perspective. Dr. Manuel Gómez Director of the Resource Center for Science and Engineering and Principal Investigator of PR-AGEP Project January 26, 2006 mgomez@hpcf.upr.edu. Presented at the

E N D
Defining Metrics to Measure Progress of Fellows at the Ph.D. Level:An AGEP Perspective Dr. Manuel Gómez Director of the Resource Center for Science and Engineering and Principal Investigator of PR-AGEP Project January 26, 2006 mgomez@hpcf.upr.edu Presented at the Second AGEP Evaluation Capacity WorkshopSponsored by National Science Foundation (NSF) and Organized by AAAS Education and Human Resources Directorate (EHR)
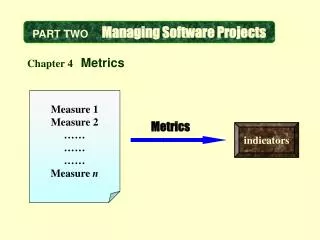
Defining Metrics to Measure Progress of Fellows at the Ph.D. Level:An AGEP Perspective • To measure the effectiveness and efficiency of the graduate education of a student, three types of Metrics or Indicators are necessary: • Input indicators • Quality of education indicators • Outcome indicators • The AGEP Program needs additional indicators: • Success in entering the professoriate • Outcome indicators of S&T career development
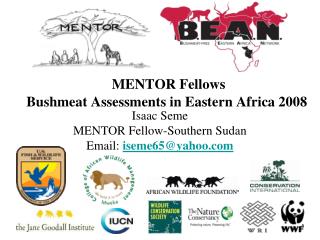
Other Employment Indicators Graduate Education Experience (Quality of Education Indicators) Institutional Culture Input Indicators Professoriate Time Longitudinal Measurements are Necessary Graduate Education As a Process
Input Indicators • Number of Students that enter any given graduate school • Quality of Candidates • Previous experience in undergraduate research • Co-authored peer reviewed papers before entering graduate school • Undergraduate grade point average in field of studies • GRE (not recommend to be used as an indicator since it has little predictive value)
Quality of Graduate Education Indicators • Teaching Assistance experience; training and preparation given for teaching function (assessment of activities) • Number of research papersco-authored by student during his research apprenticeship • Number of Peer Reviewed papers directly related to his/her dissertation • Time allowed by advisor and/or department for the development of academic skills not directly related to the student’s dissertation • Multidisciplinary research and teaching experiences • Number of presentations in national or international science forums
Institutional and DepartmentalCulture Indicators • Evaluation of Professors’ mentoring function by department • Mechanism to ensure continuous funding of students’ studies during the normal time needed to complete degree • Workshops or other enriching activities available for graduate students during their course of studies • Examples: • Scientific Proposal writing skills • Scientific paper writing skills and managing referee comments • Skills for oral and poster presentations • Communication skills • Educational methodology workshops • Development of general research methodology and epistemological skills
Output Indicators • Average time for completion of degree for cohort • Number of entering cohorts that complete the Ph.D. requirements within the average time • Number of students that get a post-doctoral experience offer • Employment history of Ph.D. graduates • Assessment of their Ph.D.experience by graduates of program, five yearsafter degree
AGEP Indicators • Number of students that completetheir Ph.D. degree in the average time for completion • Percent of AGEP Ph.D. graduates that are employed in their field of studyfive years after degree • Percent of AGEP students that have successfully enter the professoriate five year after degree • Percent of AGEP graduates that obtain tenure after entering the professoriate within 10 years of receiving the degree
Effectiveness and Efficiency of Graduate Experience Indicators Most effectiveness and efficiency indicators are ration metrics • Percent of any given cohort of entering graduate students that complete degree within the average time for completion • Percent of Ph.D. recipients that sought and obtained a Post-Doctoral Experience • Percent of graduates that were employed in their field of study and obtain positions in place of work of their choice 5 years after graduation • Percent of those who entered the professoriate that were tenured 10 years after graduation • Percent of graduates that had a positive mentoring experience in their research apprenticeship • Percent of graduate that were able to receive a broad education beyond the direct subject of their dissertation
Other Indicators of Quality • Number of peer reviewed papers five years after graduation • Number and cash value of grants received five yearsafter graduation