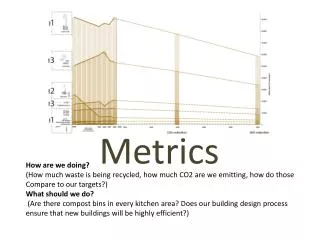
Metrics
Metrics. Original prepared by: Sudipto Ghosh Revised: Aditya Mathur. Latest update: October 28, 3003. Learning objectives. Software metrics. Metrics for various phases. Why are metrics needed. How to collect metrics. How to use metrics. Questions. How big is the program? Huge!!.

Metrics
E N D
Presentation Transcript
Metrics Original prepared by: Sudipto Ghosh Revised: Aditya Mathur Latest update: October 28, 3003
Learning objectives • Software metrics • Metrics for various phases • Why are metrics needed • How to collect metrics • How to use metrics Metrics
Questions • How big is the program? • Huge!! • How close are you to finishing? • We are almost there!! • Can you, as a manager, make any useful decisions from such subjective information? • Need information like, cost, effort, size of project. Metrics
Metrics • Quantifiable measures that could be used to measure characteristics of a software system or the software development process • Required in all phases • Required for effective management • Managers need quantifiable information, and not subjective information • Subjective information goes against the fundamental goal of engineering. Metrics
Kinds of software metrics • Product metrics • quantify characteristics of the product being developed • size, reliability • Process metrics • quantify characteristics of the process being used to develop the software • efficiency of fault detection Metrics
CMM • Level 4: Managed level • Process measurement performed • Quality and productivity goals set • Continually measured and corrective actions taken • Statistical quality controls in place • Level 5: Optimizing level • Statistical quality and process control in place • Positive feedback loop used for improvement in productivity and quality Metrics
Issues [1] • Cost of collecting metrics • Automation is less costly than manual method • CASE tool may not be free • Development cost of the tool • Extra execution time for collecting metrics • Interpretation of metrics consumes resources • Validity of metrics • Does the metric really measure what it should? • What exactly should be measured? Metrics
Issues [2] • Selection of metrics for measurement • Hundreds available and with some cost • Basic metrics • Size (like LOC) • Cost (in $$$) • Duration (months) • Effort (person-months) • Quality (number of faults detected) Metrics
Selection of metrics • Identify problems from the basic metrics • high fault rates during coding phase • Introduce strategy to correct the problems • To monitor success, collect more detailed metrics • fault rates of individual programmers Metrics
Utility of metrics • LOC • size of product • take at regular intervals and find out how fast the project is growing • What if # defects per 1000 LOC is high? • Then even if the LOC is high, most of the code has to be thrown away. Metrics
Applicability of metrics • Throughout the software process, like • effort in person-months • staff turnover • cost • Specific to a phase • LOC • # defects detected per hour of reviewing specifications Metrics
Metrics: planning • When can we plan the entire software project? • At the very beginning? • After a rapid prototype is made? • After the requirements phase? • After the specifications are ready? • Sometimes there is a need to do it early. Metrics
Metrics: planning • graph of cost estimate 4 3 Relative range of cost estimate 2 Requirements Specifications Design Implementation Integration Phase during which cost estimation is made Metrics
Planning: Cost estimation • Client wants to know: • How much will I have to pay? • Problem with • underestimation (possible loss by the developer) • overestimation (client may offer bid to someone else) • Cost • internal (salaries of personnel, overheads) • external (usually cost + profit) Metrics
Cost estimation • Other factors: • desperate for work - charge less • client may think low cost => low quality, so raise the amount • Too many variables • Human factors • Quality of programmers, experience • What if someone leaves midway • Size of product Metrics
Planning: Duration estimation • Problem with underestimation • unable to keep to schedule, leading to • loss of credibility • possible penalty clauses • Problem with overestimation • the client may go to other developers • Difficulty because of similar reasons as for cost estimation Metrics
Metrics: planning - size of product • Units for measurement • LOC = lines of code • KDSI = thousand delivered source instructions • Problems • creation of code is only a part of the total effort • effect of using different languages on LOC • how should one count LOC? • executable lines of code? • data definitions • comments? What are the pros and cons? Metrics
Problems with lines of code • Problems • More on how to count • Job control language statements? • What if lines are changed or deleted? • What if code is reused? • Not all code is delivered to clients • code may be for tool support • What if you are using a code generator? • Early on, you can only estimate the lines of code. So, the cost estimation is based on another estimated quantity!!! Metrics
Estimating size of product • FFP metric for cost estimation of medium-scale products • Files, flows and processes (FFP) • File: collection of logically or physically related records that are permanently resident • Flow: a data interface between the product and the environment • Process: functionally defined logical or arithmetic manipulation of data S = #Files + #Flows + #Process, Cost = b x S b: Organization dependent constant. Metrics
Techniques of cost estimation • Take into account the following: • Skill levels of the programmers • Complexity of the project • Size of the project • Familiarity of the development team • Availability of CASE tools • Deadline effect Metrics
Techniques of cost estimation • Expert judgement by analogy • Bottom up approach • Algorithmic cost estimation models • Based on mathematical theories • resource consumption during s/w development obeys a specific distribution • Based on statistics • large number of projects are studied • Hybrid models • mathematical models, statistics and expert judgement Metrics
COnstructive COst Model: COCOMO • Series of three models • Basic - macroestimation model • Intermediate COCOMO • Detailed - microestimation model • Estimates total effort in terms of person-months • Cost of development, management, support tasks included • Secretarial staff not included Metrics
a b System Organic Semi-detached Embedded 3.2 3.0 2.8 1.05 1.12 1.20 Intermediate COCOMO • Obtain an initial estimate (nominal estimate) of the development effort from the estimate of KDSI • Nominal effort = a X (KDSI)b person-months Metrics
Kind of systems • Organic • Organization has considerable experience in that area • Requirements are less stringent • Small teams • Simple business systems, data processing systems • Semi-detached • New operating system • Database management system • Complex inventory management system Metrics
Kind of systems • Embedded • Ambitious, novel projects • Organization has little experience • Stringent requirements for interfacing, reliability • Tight constraints from the environment • Embedded avionics systems, real-time command systems Metrics
Intermediate COCOMO (contd.) • Determine a set of 15 multiplying factors from different attributes (cost driver attributes) of the project http://sunset.usc.edu/research/COCOMOII/ • Adjust the effort estimate by multiplying the initial estimate with all the multiplying factors • Also have phase-wise distribution Metrics
Determining the rating • Module complexity multiplier • Very low: control operations consist of a sequence of constructs of structured programming • Low: Nested operators • Nominal: Inter-module control and decision tables • High: Highly nested operators, compound predicates, stacks and queues • Very high: Reentrant and recursive coding, fixed priority handling Metrics
Four major modules • data entry: 0.6 KDSI • data update: 0.6 KDSI • query: 0.8 KDSI • report generator: 1.0 KDSI • Total: 3.0 KDSI COCOMO example • System for office automation • Category: organic • Initial effort: 3.2 * 31.05 = 10.14 PM • (PM = person-months) Metrics
COCOMO example (contd) • From the requirements the ratings were assessed: • Complexity High 1.15 • Storage High 1.06 • Experience Low 1.13 • Programmer Capability Low 1.17 • Other ratings are nominal (=1.0) • EAF = 1.15 * 1.06 * 1.13 * 1.17 = 1.61 • Adjusted effort = 1.61 * 10.14 = 16.3 PM Metrics
Metrics: requirements phase • Number of requirements that change during the rremainder of the software development process • if a large number changed during specification, design, …, something is wrong in the requirements phase • Metrics for rapid prototyping • Are defect rates, mean-time-to-failure useful? • Knowing how often requirements change? • Knowing number of times features are tried? Metrics
Metrics: specification phase • Size of specifications document • may predict effort required for subsequent products • What can be counted? • Number of items in the data dictionary • number of files • number of data items • number of processes • Tentative information • a process in a DFD may be broken down later into different modules • a number of processes may constitute one module Metrics
Metrics: specification phase • Cost • Duration • Effort • Quality • number of faults found during inspection • rate at which faults are found (efficiency of inspection) Metrics
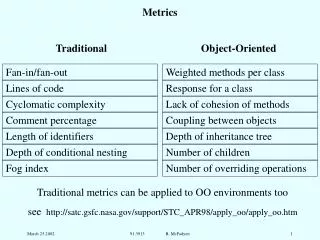
Metrics: design phase • Number of modules (measure of size of target product) • Fault statistics • Module cohesion • Module coupling • Cyclomatic complexity • Fan-in, fan-out Metrics
1-2+2=1 4-4+2=2 3-3+2=2 Straight line code if-then-else while-do Mccabe’s Cyclomatic Complexity Number of independent test paths=edges-nodes+2 Metrics
McCabe’e Cyclomatic complexity • Number of binary decisions + 1 • The number of branches in a module • Lower the value of this number, the better • Only control complexity, no data complexity • For OO, cyclomatic complexity is usually low because methods are mostly small • also, data component is important for OO, but ignored in cyclomatic complexity Metrics
Architecture design as a directed graph • Fan-in of a module: • Fan-out of a module: • number of flows out of the module plus the number of data structures updated by the module • Measure of complexity: • length X (fan-in X fan-out)2 Metrics
Metrics: implementation phase • Intuition: more complex modules are more likely to contain faults • Redesigning complex modules may be cheaper than debugging complex faulty modules • Measures of complexity: • LOC • assume constant probability of fault per LOC • empirical evidence: number of faults related to the size of the product Metrics
Metrics: implementation phase • McCabe’s cyclomatic complexity • Essentially the number of branches in a module • Number of tests needed for branch coverage of a module • Easily computed • In some cases, good for predicting faults • Validity questioned • Theoretical grounds • Experimentally Metrics
Metrics: implementation phase • Halstead’s software metrics • Number of distinct operators in the module (+. -. If, goto) • Number of distinct operands • Total number of operators • Total number of operands Metrics
Metrics: implementation phase • High correlation shown between LOC and other complexity metrics • Complexity metrics provide little improvement over LOC • Problem with Halstead metrics for modern languages • Constructor: is it an operator? Operand? Metrics
Metrics: implementation and integration phase • Total number of test cases • Number of tests resulting in failure • Fault statistics • Total number of faults • Types of faults • misunderstanding the design • lack of initialization • inconsistent use of variables • Statistical testing: • zero-failure technique Metrics
Zero failure technique • The longer a product is tested without a single failure being observed, the greater the likelihood that the product is free of faults. • Assume that the chance of a failure decreases exponentially as testing proceeds. • Figure out the number of test hours required without a single failure occurring. Metrics
Metrics: inspections • Purpose: to measure the effectiveness of inspections • may reflect deficiencies of the development team, quality of code • Measure fault density • Faults per page - specs and design inspection • Faults per KLOC - code inspection • Fault detection rate - #faults / hour • Fault detection efficiency - #faults/person-hour Metrics
Metrics: maintenance phase • Metrics related to the activities performed. What are they? • Specific metrics: • total number of faults reported • classifications by severity, fault type • status of fault reports (reported/fixed) Metrics
References • Textbook • Roger Pressman: Chapters 4, 19 • Other books • P. Jalote - An Integrated Approach to Software Engineering (Look at metrics under Index) • Internet reference www.cs.waikato.ac.nz/~bernhard/314/schachSlides/ schach5-chap09-14%5B1%5D.ppt Metrics