Download
1 / 70
710 likes | 1.05k Vues
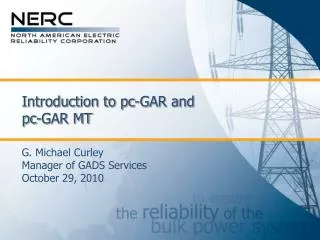
Introduction to pc-GAR and pc-GAR MT. G. Michael Curley Manager of GADS Services October 29, 2010. Data Sources. Generator “C”. Generator “D”. Generator “B”. Generator “A”. GADS. Generator “E”. 280+ Generators Reporting 5,800+ units, including international affiliates.

E N D
Introduction to pc-GAR and pc-GAR MT G. Michael CurleyManager of GADS ServicesOctober 29, 2010
Data Sources Generator “C” Generator “D” Generator “B” Generator “A” GADS Generator “E” 280+ Generators Reporting 5,800+ units, including international affiliates.
What is pc-GAR? • Unique software product to allow access to the data collected in the GADS database. • It reports equipment outage information for the purpose of improving electric power output. pc-G.A.R
Why pc-GAR? • Introduced in 1992 • Created to: • Reduce the number of special studies produced annually. • Allow users quick access to GADS information. • Increase the need to maintain good outage records. • Only one of it’s kind in the world! • WEC wants to follow this example
With data mining, you take advantage of past experience … you learn from the past to prepare for the future.
Fossil Fluidized bed fossil Nuclear Gas Turbine Jet Engine Diesel Hydro Pumped Storage Combined Cycle Geothermal Co-generator Multi-boiler/Multi-turbine Unit Types Available (12 choices)
Units Selections • All Including Own • All Except Own • Own Units • United States Only • Canada Only • 2 Regions required for analysis
Class “Yes” or “No” types Super or sub-critical General Electric or other manufacturer Balanced or pressurized draft Continuous Range MW size (1-1400 MW) Steam Pressure (1-3600 psig) EAF (0-100%) Two Types of Variables
Three Groups of Criteria Selection • Physical (class) • Example: # of pumps • Performance (continuous) • Example: # of service hours • Statistics (continuous) • Example: EFOR
Help #1 – Selecting Fuels • Two fuel selections • “As designed” means what the unit was designed to burn. • “Actual fuel burned” means what did the unit actually burn in the specific year. • 100% of the “actual burned” fuels • 90% of the “designed fuels”
Help #1 – Selecting Fuels Actual Fuel Burned Design Fuel
Help #2 – Apply Criteria By… • You can apply the performance/fuel criteria by either year or range. • Year – tests the criteria on a year by year basis. A unit may pass the test one year but not the next. Only the one year where it passed will be in the survey. • Range – tests the criteria on the average for the period you selected. If you picked a 5-year period for an EAF > 85%, then the average EAF for the period is tested. If it fails, that unit will be removed from the survey.
Help #2 – Apply Criteria By… If criteria included EAF of 85% or greater, then 3 of 4 years accepted using “Year” button. Accepted EAF = 90.40% Accepted EAF = 87.56% Rejected EAF = 84.55% Accepted EAF = 85.98% If criteria included EAF of 85% or greater, then average EAF of 4 years accepted using “Range” button. EAF = 86.91% Accepted
Help #3 – for Years/for Periods • Events and performance data are divided into monthly intervals for retrieving and analyzing data by months, years, and multi-year periods. • When using less than one year, use: • “Annual/monthly Unit Summary Report” for viewing monthly numbers. • “Unit-year Statistical Report” for projections of how the unit would operate if operated in the same manner as the short period.
Help #3 – for Years/for Periods Data pulled for months 01 to 12 for three years. Year 1 Year 2 Year 3 Jan Feb …. Nov Dec Jan Feb …. Nov Dec Jan Feb …. Nov Dec Data pulled for months 11 to 02 for three years. Year 1 Year 2 Year 3 Jan & Feb Nov to Feb Nov to Feb Nov Dec
Help #4 – Adding/removing Units • pc-GAR allows you to add or remove youp own units from any selected group (“units included in report”) • You cannot remove units that NERC considers not yours (even if you are a part-owner.) “Ownership” (to NERC) is the organization reporting data to GADS.
Help #4 – Adding/removing Units All own units Own units in report.
Help #4 – Adding/removing Units First, select one unit at a time to move. Next, click on the Button to add own units to report.
Help #4 – Adding/removing Units The unit is now added.
Help #4 – Adding/removing Units To remove a unit from the report, first highlight the unit then click on the “remove unit” bottom.
Help #4 – Adding/removing Units The unit is now back into the “own unit” list and out of the report.
Help #5 – Same Peer Group • This procedure allows you to use the same group of units from one period to the next, assuming the same units reported in both periods. • First, select the group of units using the standard procedure for choosing a group. • Second, in “Menu of Reports,” choose “Report Data Range.” • Third, select a new period to analyze.
Help #5 – Same Peer Group Some criteria may change from one period to the next as shown here. Select criteria and then save.
Help #5 – Same Peer Group Select a new period here.
Help #5 – Same Peer Group Here you select a new period for analysis using the same group of units.
Help #6 – Single, Own Unit Report • For when you want to create a pc-GAR report for just one of your own units. • Normal selection procedure for own units. • Remove all but the single unit from the “Units included in Report” section. • Apply criteria as “Reapply Criteria …”
Help #6 – Single, Own Unit Report Choose “Own Units” to remove any units not under your control.
Help #6 – Single, Own Unit Report Select the unit(s) you wanted to analyze. You can pick more than one if you want for a single group or show the performance of a plant. Suppose we want to see the performance of 3 units.
Help #6 – Single, Own Unit Report After removing all but the 3 units using the “remove unit” button, you return to the “Report Design” section of the Criteria Entry.
Help #6 – Single, Own Unit Report Apply the Criteria.
Help #6 – Single, Own Unit Report Choose the “event option” you want (see Trick #7 for details) and click “ok”.
Help #6 – Single, Own Unit Report Select “Re-apply Criteria …” option to pull data for just the 3 units. If you use the other option, you’ll be back where you started with all of your own units.
Help #6 – Single, Own Unit Report Now you have only 3 units for your report. Save the file. Print the report as you normally do.
Help #7 – Data Making Statistics • There are three options for choosing the units and data for making the statistics in the reports: • Units that report both event & performance records and units reporting performance data only. • Units that report both event and performance data only. • Units that report both event and performance data for all years of the period.
Help #7 – Data Making Statistics This option includes all units reporting to GADS, whether they reported events data or not. This option may show differences in statistics like EAF, EFOR, EFORd, etc because not all units reported deratings.
Help #7 – Data Making Statistics This option includes all units reporting to GADS where events are reported during the period being examined. This option will show accurate statistics like EAF, EFOR, EFORd, etc because all units report deratings.
Help #7 – Data Making Statistics This option includes all units reporting to GADS where events were reported during the complete period being examined. If you were examining 5 years, the unit would have to report events all 5 years. This option will show accurate statistics like EAF, EFOR, EFORd, etc. because all units reported deratings.
Help #8 – Start Fresh or Re-examine? • When retrieving data, you have the option to start fresh each time or re-examine the existing data. • It is faster to start with a big group, add a criteria, and then re-examine the group as each criteria is added.
Help #8 – Start Fresh or Re-examine? Always uses this option when starting a new retrieval or increasing the population of an existing retrieval.
Help #8 – Start Fresh or Re-examine? Use this option if you are “trimming” an existing retrieval. Never use it if you suspect that the population of the retrieval will increase.
Help #9 – Inclusion • In pc-GAR, the software assume you want everything unless you specify that you only want something special. • For example, the program will assume you want all NERC Regions unless you specify you only want two certain Regions.
Help #10 – Exclusion • In pc-GAR, you may have to specify you DON’T WANT something in order to get the condition you really want. • For example, if you wanted units with a single reheater in the boiler, you would have to specify that the first RH section is 1 to 9999 psig and the second RH section is 0 to 0 psig.
Help #10 – Exclusion By placing a “0” (zero) in some criteria, you can focus on special cases of design. Here we locate single RH units and remove non- and double RH.
Question & Answer On to the demo…
Class Example 100-300 MW Oil Unit • Example for locating your unit for comparing to others • AF and EAF distributions • Suppose that your unit is between 100-300 MW and burns oil as its primary fuel. How would you locate other units in GADS and compare yourself to them?
Class Example 100-300 MW Oil Unit STEP Double Click on pc-GAR icon Click on “New Report Wizard” Input Study Description Input Author Click on pull down menu for “Unit Type” Click on desired Unit Type (fossil-steam) Click on pull down menu for “Units” Click on “All Units Including Own” Click on “Next” Enter “1993” through “1997” in “Years” window
Class Example 100-300 MW Oil Unit STEP Click on “Add a Criteria” Button Select Window for 1st Criteria Category (Physical, Performance or All) Enter Select Criteria Click on “Add a Criteria Button” Select Window for 2nd Criteria Category Enter Select Criteria Click on “Apply Criteria” Click on “OK” Note number of Units Selected Click on “Next”