Fiscal Policy for Economic Growth
350 likes | 383 Vues
Learn about federal budget processes, deficits, debts, and the impact of fiscal policy on economic growth. Explore the role of Keynesian and classical economists in shaping macroeconomic theories.

Fiscal Policy for Economic Growth
E N D
Presentation Transcript
31 Fiscal Policy CHAPTER CHECKLIST When you have completed your study of this chapter, you will be able to • 1Describe the federal budget process and the recent history of revenues, outlays, deficits, and debts. • 2 Explain the supply-side effects of fiscal policy on employment and potential GDP. • 3 Explain the demand-side effects of fiscal policy on employment and real GDP.
THE FEDERAL BUDGET • The federal budget is an annual statement of the revenues, outlays, and surplus or deficit of the government of the United States. • The federal budget has two purposes: • To finance the activities of the federal government • To achieve macroeconomic objectives • Fiscal policy is the use of the federal budget to achieve the macroeconomic objectives of high and sustained economic growth and full employment. • The Council of Economic Advisers helps • the President set the budget/fiscal policy.
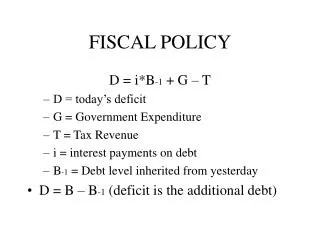
THE FEDERAL BUDGET • Budget Surplus, Deficit • Budget balance = Tax revenues – Outlays (Expenditures) • The government has a balanced budget when tax revenues equal outlays (budget balance is zero). • The government has a budget surplus when tax revenues exceed outlays (budget balance is positive). • The government has a budget deficit when outlays exceed tax revenues budget balance is negative).
THE FEDERAL BUDGET • Surplus, Deficit, and Debt • The government borrows to finance a budget deficit and repays its debt when it has a budget surplus. • The amount of debt outstanding that arises from past budget deficits is called national debt. • Debt at end of 2010 = Debt at end of 2009 + Budget deficit in 2010. • The Federal government receives the most money from Personal Income Taxes. It spends the most money on Transfer Payments.
Varying Economic Theories • Schools of Thought and Cracks in Today’s Consensus • The three main schools of macroeconomic thought (theories) are classical, Keynesian, and monetaristmacroeconomics. • Today’s consensus is one that takes insights from each of the schools. • While there is a consensus, the macroeconomic events of 2008 and 2009 have placed the consensus under some stress and cracks are emerging. • The main crack is between the views of Keynesian economists and others.
Classical Economists • Prominent Economists – Adam Smith, David Ricardo, and Davis Malthus • Core belief – Lassiez-faire policies; economies are self-regulating in the long-run and free markets will always get back to equilibrium eventually • The government shouldn’t intervene, just let things in the economy play out and let competition drive it.
Keynesian Economists • Prominent Economists – John Maynard Keynes • The Great Depression challenged all former beliefs about economics because things didn’t regulate… Wrote a book called The General Theory of Employment, Interest and Money that dispelled the Classical view of the long-run and provided the government with some tools for the “short-run”… what they could do now to fix problems. • Keynes believed that during a recession or depression, consumers and businesses demand less – which causes GDP and output to go down. If the government could intervene and spend money, it encourage production and employment. When people got back to work, they would start consuming again, and the economy would turn around. • This mind-set is known a “demand-side” economics – involves changing demand to help the economy. • Keynes argued that governments could influence demand by changing their spending habits and changing taxes (fiscal policy). Said that a change in spending or taxes could have an impact of a multiple that is greater than the initial spending or tax. This is known as the multiplier effect.
THE DEMAND SIDE: STABILIZING REAL GDP The Keynesian View The Keynesian view is that fiscal stimulus—an increase in government outlays (spending) or a decrease in tax revenues—boosts real GDP and creates or saves jobs. Fiscal stimulus boosts real GDP and employment by increasing aggregate demand and the fiscal stimulus has a multiplier effect. Keynesians say that these positive effects of fiscal stimulus make it a vital and powerful tool in the fight against deep recession and depression.
THE DEMAND SIDE: STABILIZING REAL GDP • The Mainstream View • The mainstream view is that Keynesians overestimate the multiplier effects of fiscal stimulus and their effects are small, short-lived, and incapable of working fast enough to be useful. • Mainstream economists say that government stimulus “crowds out” investment. • The durable results of a fiscal stimulus are bigger government, lower potential GDP, a slower real GDP growth rate, and a greater burden of government debt on future generations.
THE DEMAND SIDE: STABILIZING REAL GDP • Fiscal Policy and Aggregate Demand • Discretionary Fiscal Policy is a purposeful change in government outlays or in tax revenues. • Other things remaining the same, a change in any item in the government budget changes aggregate demand. • The change in aggregate demand has a multiplier effect— aggregate demand changes by a greater amount than the initial change in the item in the government budget. • The purpose of this is to promote full employment, price stability, and economic growth (GDP)
Expansionary Fiscal Policy Potential GDP is $13 trillion, real GDP is $12 trillion, and 1.There is a $1 trillion recessionary gap. 2. An increase in government expenditure or a tax cut increases expenditure by ∆E.
THE DEMAND SIDE: STABILIZING REAL GDP 3. The multiplier increases induced expenditure. The AD curve shifts rightward to AD1. The price level rises to 110, real GDP increases to $13 trillion, and the recessionary gap is eliminated.
Contractionary Fiscal Policy Potential GDP is $13 trillion, real GDP is $14 trillion, and 1.There is a $1 trillion inflationary gap. 2. A decrease in government expenditure or a tax rise decreases expenditure by ∆E.
Contractionary Fiscal Policy 3. The multiplier decreases induced expenditure. The AD curve shifts leftward to AD1. The price level falls to 110, real GDP decreases to$13 trillion, and the inflationary gap is eliminated.
THE DEMAND SIDE: STABILIZING REAL GDP • Automatic (built-in) stabilizer is a fiscal policy action that is triggered by the state of the economy. The government takes no explicit action. • For example, an increase in unemployment induces an increase in payments to the unemployed or in a recession, tax receipts decrease as incomes fall. • Discretionary stabilizer is a fiscal policy action that is initiated by an act of Congress. • For example, an increase in defense spending or a cut in the income tax rate.
THE DEMAND SIDE: STABILIZING REAL GDP • Discretionary Fiscal Policy • The use of discretionary fiscal policy is seriously hampered by four factors: • Law-making (Administrative) time lag • Shrinking area of law-maker discretion- 80% of the budget is set automatically • Estimating potential GDP (Recognition Lag – the time between the beginning of recession or inflation and the awareness that it is happening) • Economic forecasting (Operational Lag, by the time the policy effects the people, the GDP situation may be different)
THE SUPPLY SIDE: POTENTIAL GDP AND GROWTH • Fiscal policy influences the output gap by changing aggregate demand and real GDP relative to potential GDP. • But fiscal policy also influences potential GDP and the growth rate of potential GDP. • These influences on potential GDP and economic growth arise because • The government provides public goods and services that increase productivity and • Taxes change the incentives the people face.
THE SUPPLY SIDE: POTENTIAL GDP AND GROWTH • Supply-side effectsare the effects of fiscal policy on potential GDP. • Supply-side effects operate more slowly than the demand-side effects. • Supply-side effects are often ignored in times of recession when the focus is on fiscal stimulus and restoring full employment. • But in the long run, the supply-side effects of fiscal policy dominate and determine potential GDP.
Supply-Side Economists • Prominent Economists – Arthur Laffer • Promoted a supply-side approach to fiscal policy. Supply-siders believe that taxes have strong negative influences on output and as such, the focus should be on increasing aggregate supply not demand. • Created the Laffer Curve that illustrates the relationship between the tax rate and tax revenue that the government collects. Laffer believed that high taxes do not mean more revenue if the tax causes spending/investment to decrease. • Laffer said that if the government cut taxes, businesses would hire more people, total employment would increase and the government could collect even more taxes at the lower rate.
THE LAFFER CURVE 100 Tax rate (percent) l 0 Tax revenue (dollars)
THE LAFFER CURVE 100 Tax rate (percent) m l 0 Tax revenue (dollars)
THE LAFFER CURVE 100 n Tax rate (percent) m l 0 Tax revenue (dollars)
THE LAFFER CURVE 100 n Tax rate (percent) m m Maximum Tax Revenue l 0 Tax revenue (dollars)
THE SUPPLY SIDE: POTENTIAL GDP AND GROWTH • Full Employment with No Income Tax • The wage rate is $30 an hour and 250 billion hours of labor is employed.
THE SUPPLY SIDE: POTENTIAL GDP AND GROWTH The economy is at full employment with 250 billion hours of labor employed. The production function shows that when 250 billion hours are employed, potential GDP is $14 trillion.
THE SUPPLY SIDE: POTENTIAL GDP AND GROWTH • The Effects of the Income Tax • The income tax • 1. Decreases the supply of labor. • 2. Creates a tax wedge between the wage rate that firms pay and workers receive.
THE SUPPLY SIDE: POTENTIAL GDP AND GROWTH • 3. The before-tax wage rate rises to $35 an hour. • 4. The after-tax wage rate falls to $20 an hour. • 5. Full employment decreases to 200 billion hours.
THE SUPPLY SIDE: POTENTIAL GDP AND GROWTH 5. Full employment decreases to 200 billion hours. 6. Potential GDP decreases to $14 trillion.
THE SUPPLY SIDE: POTENTIAL GDP AND GROWTH 1. A tax cut increases disposable income, which increases aggregate demand from AD0 to AD1. A tax cut also strengthens the incentive to work, save, and invest, which increases aggregate supply from AS0 to AS1. 2. Real GDP increases.
THE SUPPLY SIDE: POTENTIAL GDP AND GROWTH • Long-Run Fiscal Policy Effects • The long-run consequences are the most profound ones. • If investment is crowded out by a large budget deficit, the economic growth rate slows and potential GDP gets ever farther below what it might have been as the Lucas wedge widens. • If a large budget deficit persists, debt increases, confidence in the value of money is eroded, and inflation erupts. • It is vital that government outlays and budget deficits be kept under control.