Download
1 / 30
300 likes | 332 Vues
Explore the impact of plate gap calibration and non-linearities on velocity measurements using Chandra gratings, with a focus on HETGS examples and spatial non-linearity mapping strategies.

E N D
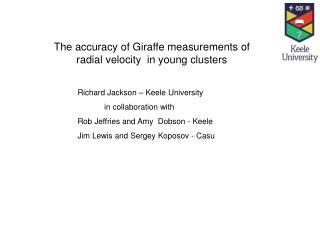
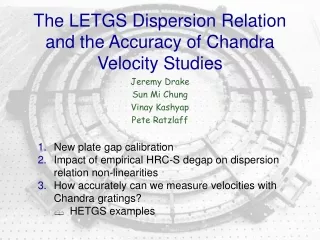
The LETGS Dispersion Relation and the Accuracy of Chandra Velocity Studies Jeremy Drake Sun Mi Chung Vinay Kashyap Pete Ratzlaff • New plate gap calibration • Impact of empirical HRC-S degap on dispersion relation non-linearities • How accurately can we measure velocities with Chandra gratings? • HETGS examples
XRCF Plate Gap Calibration (M.Juda) • Geometry of finite thickness HRC-S plates --> position error • Additional correction arises from different LETG+HRC-S disp rel cf that known at XRCF Residual slope
Dispersion Relation Post-Bug Fix • Clarified apparent plate gap problem • Non-linearities not affected
New Plate Gap Calibration • Removes discontinuities between plates • Resulting RMS deviation=0.013 AA (~0.01% @100AA)
Mapping HRC-S Spatial Non-Linearity • Examine events from bright well-understood lines in detector coordinates (tdety) • BUT: Relatively few bright lines - poor coverage • Cross-correlate spectra in small wavelength intervals extracted from different dither phases • At any given wavelength, maps out relative position error between areas of the detector ~1mm apart. • Effective for any spectra with significant structure; does not require “high quality” lines
Mapping HRC-S Spatial Non-Linearity • Examine events from bright well-understood lines in detector coordinates (tdet y) • BUT: Relatively few bright lines - poor coverage • Cross-correlate spectra in small wavelength intervals extracted from different dither phases • At any given wavelength, maps out relative position error between areas of the detector ~1mm apart. • Effective for any spectra with significant structure; does not require “high quality” lines
Mapping HRC-S Detector Non-Linearities • Examine events from bright well-understood lines in detector coordinates (tdet y) • BUT: Relatively few bright lines - poor coverage • Cross-correlate spectra in small wavelength intervals extracted from different dither phases • At any given wavelength, maps out relative position error between areas of the detector ~1mm apart. • Effective for any spectra with significant structure; does not need “high quality” lines
Eg extract spectra for times when source is here and here Dither-Split Cross-Correlation Region 1 2 3 4
Dither-Split Cross-Correlation LETG+HRC-S -ve orders
Testing an Empirical Degap • Is non-linearity caused by degap deficiencies? • Empirical degap correction derived for “dispersion strip” of HRC-S based on bright continuum source (PKS2155-304) • Vinay’s talk • Applied to Capella observations • Analysed using cross-correlation and tdety techniques
In tdety Standard degap In-flight degap
Vast improvements!! But…. Dither-Split Cross-Correlation
How accurately can we measure velocities with Chandra? • Provided line profile is adequately sampled, centroid accuracy in principle depends only on S/N • BUT: at some level, other systematics will dominate • Line blends • Detector imperfections • Optical bench stability • Aspect error • etc
Capella: Wavelength Calibration Standard G1III + G8III • 108 day orbital period • Projected orbital speed ~25 km/s • G1 8 day spin period • Equatorial velocity ~36 km/s
HETGS (MEG) Dispersion Relation Based on “unblended” lines with accurately-known wavelengths Capella (G1III+G8III) 0th order centroid determined by +/- cross-correlation
HETGS (MEG) Dispersion Relation Based on “unblended” lines with accurately-known wavelengths Capella (G1III+G8III) 0th order centroid determined by +/- cross-correlation
HETGS (MEG) Dispersion Relation Based on “unblended” lines with accurately-known wavelengths Capella (G1III+G8III) 0th order centroid determined by +/- cross-correlation
HETGS (MEG) Dispersion Relation Based on “unblended” lines with accurately-known wavelengths Capella (G1III+G8III) 0th order centroid determined by +/- cross-correlation
HETGS (MEG) Dispersion Relation Based on “unblended” lines with accurately-known wavelengths Capella (G1III+G8III) 0th order centroid determined by +/- cross-correlation
Algol (B8V + K2 III) X-ray dark Roche-lobe filling, coronally active Period =2.8d; secondary orbital speed ~180 km/s
Algol (B8V + K2III) • 2.8 day orbital period • 180 km/s orbital speed
Algol Line Centroid Analysis Centre of gravity velocities
Statistical uncertainties as low as 10 km/s But… Algol Cross-Correlation Analysis Use all of MEG spectra of Algol vs Capella - greatly increase S/N
Comparing Observed FWHM and RMF Capella FWHM in fairly good agreement with RMF Evidence for excess Line width in Algol Orders: -sum+
Algol Line Profiles ~100 km/s extra Broadening required Chandra MEG
Conclusions • RMS devations in LETG+HRC-S now down to 0.013 AA • Have tools to probe dispersion non-linearity • In-flight degap helps but does not solve the problem • Cross-correlation techniques permit potentially very accurate velocity studies (~10 km/s) • BUT systematics seem to dominate at 20-30 km level