Download
1 / 36
360 likes | 373 Vues
This report presents the analysis of Oasis data from 2007 to 2010, focusing on trends in the total population and individual CBs. It includes analysis of entries, nonconformities, AS9100 elements, feedback, and monitoring. The report also examines ANAB audit summaries, statistical assessment models, and threshold violations. Additionally, it identifies CBs with outstanding feedback responses and negative shifts in performance.

E N D
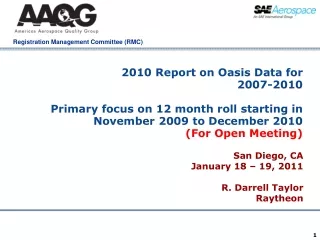
2010 Report on Oasis Data for2007-2010Primary focus on 12 month roll starting in November 2009 to December 2010(For Open Meeting) San Diego, CA January 18 – 19, 2011 R. Darrell TaylorRaytheon
Executive Summary • Setting a Baseline for the future • Statistically Based Analysis • Two-fold Analysis of data • Trends for the total population • Trends for the individual CB’s
Agenda • OASIS Entries – Audits • OASIS Nonconformities • AS9100 Elements – Quick Overview no change • Feedback • Monitoring Model
Projecting a flat to a slight increase compared to 2009 year Comparison of Entries 2007 -2010 • Entries: • 2007 – 5114 • 2008 – 5972 ^14% • 2009 – 6969 ^17% • 2010 – 5987 • As of 12/2010 Consistent with Record Entry Delays
Comparison of Types2007 -2010 SUR=Surveillance REC = Recertification INT = Initial NOTE : 2010 is still not complete, consistent with previous years
Standards Entered Into Database 2 AS9100C audits now in the database
Summary of OASIS Data MAJORS MINORS Minors – 15,814 Majors - 1117 Average number of Non Conformities per audit slightly over 3 Average number of minors 2.4 per audit On average a major is written every 5th audit
AS9100 Nonconformities Top 10 Will monitor as we transition to AS9100C and determine if there are any industry related trends Top Ten 2010 same as 2009 & 2008
Feedback Analysis 2009 average 112 per month, none in December 2008 – average 110 per month as of August
ANAB Audit Summary • 2010 • 6.07 Minors per audit, .4 Majors per audit • Other Categories monitored: • Escalated N/C Customer Complaints • Negative Shift Suspensions (2 Yrs) • Additional Audits • N/C from outside assessments
Certification Body Statistical Assessment Model General - 1 Criteria Feedback - 2 Criteria + 1 Customer Complaints Suspensions C/A’s outside of Audits Extra Audits OASIS Results - 3 Criteria ANAB Performance - + 4 ANAB Audits - 6 Criteria Added Old Feedback “OPEN” as separate criteria
Threshold Violations • RMC & ANAB need to research • >6 • ANAB to report to RMC • 4-5 • ANAB to investigate • 2-3 • No Action • <2
Non - Statistical Driven Metrics • Feedback (Only 9 CB’s did not have a hit) • Closed > average 30 Days • Open > average 30 Days • OPEN over one year • Escalated N/C’s (9 CB’s had escalated N/C’s)
Identify those CB’s in the top 5 % receiving Minors from ANAB audits ANAB Audits - Minors Normal Distribution
Identify those CB’s in the top 5 % receiving Majors from ANAB audits ANAB Audits - Majors NOT Normal Distribution
ANAB Audits – Majors (cont.) Poisson Distribution supports the use of > 2 as threshold
ANAB Audits – Ratio Total Identify those CB’s in the top 5 % receiving Nonconformities as a ratio to audits performed from ANAB audits Normal Distribution
ANAB Audits – Ratio Minors Identify those CB’s in the top 5 % receiving Minors as a ratio to audits performed from ANAB audits Normal Distribution
ANAB Audits – Ratio Majors Identify those CB’s in the top 5 % receiving Majors as a ratio to audits performed from ANAB audits NOT Normal Distribution
ANAB Audits – Ratio Majors (cont.) Poisson Distribution supports the use of >1
ANAB Score Negative Shift • Formula TY Ratio of Total – LY Ratio of Total • Trigger count if decrease is > than 1 SD (TY) • Based on a one standard deviation shift in the negative direction, may be an indicator of a potential issue TY= This Year LY = Last Year SD= Standard Deviation Identify those CB’s with a greater than one standard deviation shift in performance in the negative direction
FEEDBACK • Rule of Thumb threshold > 30 days based on “Closed” • Rule of Thumb threshold > 30 days based on “Currently OPEN” • Rule of Thumb any violation of older “OPEN” feedback Identify CB’s with outstanding feedback responses >30 days
ANAB DATA – CB Performance • Additional ANAB Audits >0 • Escalated Nonconformities > 0 • Customer Complaints > 2 over two years • Corrective Actions issued outside of Assessment Minors >1, Majors >0 • Suspensions in past 2 years >0 • Outside Assessment Influence
OASIS Ratio of Total Findings Modified Modified criteria excluding outlier
Ratio Majors/Entries Totals 2010 – 1117 YTD 2009 -1135 2008 – 976 2007 - 870 On average, one Major is written every fifth audit – NOTE: Average down to .21 per audit for 2010 (1/5 audits)
OASIS Ratio of Majors Identify CB’s in the bottom 5% writing majors NOT Normal Distribution
OASIS Ratio of Majors - Modified Normal Distribution after a transformation
Ratio Minors/Entries Totals 2010 – 15,814 YTD 2009 -19,414 2008 -17,393 2007 –14,087 On average, 2.8 Minors are written every audit, down to 2.47 minors per audit
OASIS Ratio of Minors Identify CB’s in the bottom 5% writing minors Normal Distribution
AS9100 Nonconformities Quantities NO CHANGE
Time – Line, Data Presentation JAN MAR JUL SEP First 6 Months Summary Previous Year Summary RULE VIOLATORS