Advanced Migration Deconvolution for Improved Seismic Data Resolution
400 likes | 481 Vues
Explore migration deconvolution techniques to enhance resolution and reduce distortion in 3D seismic data. Detailed numerical tests and conclusions presented.

Advanced Migration Deconvolution for Improved Seismic Data Resolution
E N D
Presentation Transcript
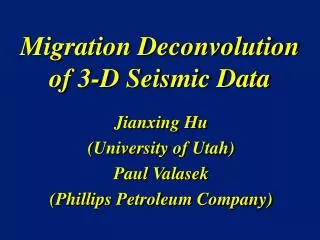
Migration Deconvolution of 3-D Seismic Data Jianxing Hu (University of Utah) Paul Valasek (Phillips Petroleum Company)
Outline • Problem • Solution • Numerical tests • Conclusions
Problems • Poor Resolution • Amplitude Distortion • Migration noise • Recording footprint 0km 5km 10km 15km 0km 4km Kirchhoff Migration Image
Modeling and Migration Forward Modeling: Model Space Green’s Function Reflectivity Wavelet Seismic data Migration: Data Space Migrated Image Seismic Data
Relation of Migrated Image and Reflectivity Distribution Model Space Where: Data Space Denote as the migration Green’s Function
Reflectivity Modulated by Migration Green’s Function Model Space
Outline • Problem • Solution • Numerical tests • Conclusions
Solution Get rid of the influence of migration green’s function from the migrated image Method: • Migration Deconvolution
Migration Deconvolution Assumption: Migration Green’s function lateral shift invariant Model Space Model Space --- reference position of migration Green’s function
Outline • Problem • Solution • Numerical tests • Conclusions
Numerical Tests • 2-D SEG/EAGE overthrust model • 3-D poststack Kirchhoff migration of French model data set • 3-D poststack reverse time migration of a gulf of Mexico data set • 3-D prestack Kirchhoff migration of • a North Sea data set
0km 5km 10km 15km 0 6000 1500 Velocity (m/sec) Depth (m) 3000 2500 4500 Velocity Model
0 km 0 km 4 km 4 km • 0 km Comparison of KM and MD • 15 km • Poststack Migration Image 0 km 15 km • Deconvolved Migration Image
Comparison of KM and MD 0 km 4 km 0 km 15 km • Poststack Migration Image of Half Sampled Data • 0 km • 15 km 0 km 4 km • Deconvolved Migration Image
0 km • 20 km 0 km 4 km • 0 km 20 km 0 km 4 km Comparison of KM and MD • Prestack Migration Image • Deconvolved Migration Image
Numerical Tests • 2-D SEG/EAGE overthrust model • 3-D poststack Kirchhoff migration of French model data set • 3-D poststack reverse time migration of a gulf of Mexico data set • 3-D prestack Kirchhoff migration of • a North Sea data set
French Model X (km) 0 4 8 0 • 10,000 ft/sec 1 10,000 ft/sec Tested Area • 2 Depth (km) 19,000 ft/sec 13,000 ft/sec 4 19,000 ft/sec 5
1 • 3 • 3 • 5 • 2 • 2 • 3 • 5 • 2 • 2 • 4 • 4 • Depth (km) • Depth (km) • 4 • 4 Comparison of KM and MD Results X (km) X (km) Inline Section Y (km) Y (km) • 1 • 3 Crossline Section • KM • MD • MD
3 3 4 4 5 5 0.3 1.3 2.3 3.3 Comparison of KM and MD Results X (km) • 0 • 8 0 1 10,000 ft/sec Depth (km) • Test Area 2570 m 13,000 ft/sec 19,000 ft/sec 5 • Sharper X (km) X (km) 0.3 1.3 Y (km) 2.3 Sharper 3.3 • KM • MD
Numerical Tests • 2-D SEG/EAGE overthrust model • 3-D poststack Kirchhoff migration of French model data set • 3-D poststack reverse time migration of a gulf of Mexico data set • 3-D prestack Kirchhoff migration of • a North Sea data set
Poststack RTM Image of a Gulf of Mexico Data Set • X(km) 6 9 • 0 • 3 • 12 • 1 • 2 • Depth(km) • 3 • 4
Velocity Model X (km) 0 6 12 0 1.6km/s 1 3km/s 2 3 Depth (km) 4.45km/s 4 5 6
5 • 1 Comparison of RTM and MD Images RTM MD • 6 • 6 • 5 • 1 • 2 • 2 • Depth (km) • Depth (km) • 3 • 3 • X(km) • X(km)
Comparison of RTM and MD Images RTM MD • 7.0 • 7.0 • 7.4 • 7.4 • 1 • 1 • 2 • 2 • Depth (km) • Depth (km) • 3 • 3 • Y(km) • Y(km)
X (km) • X (km) • X (km) • X (km) • 6.0 • 6.0 • 6.0 • 6.0 5.0 5.0 5.0 5.0 • 7.0 • 7.0 • 7.0 • 7.0 • Y (km) • Y (km) • Y (km) • Y (km) • 7.5 • 7.5 • 7.5 • 7.5 Comparison of Depth Slices • RTM Image • MD Image • RTM Image • MD Image
X (km) • X (km) • X (km) • X (km) • 6.0 • 6.0 • 6.0 • 6.0 5.0 5.0 5.0 5.0 • 7.0 • 7.0 • 7.0 • 7.0 • Y (km) • Y (km) • Y (km) • Y (km) • 7.5 • 7.5 • 7.5 • 7.5 Comparison of Depth Slices • RTM Image • MD Image • RTM Image • MD Image
Numerical Tests • 2-D SEG/EAGE overthrust model • 3-D poststack Kirchhoff migration of French model data set • 3-D poststack reverse time migration of a gulf of Mexico data set • 3-D prestack Kirchhoff migration of • a North Sea data set
4 • 4 • 6 • 6 • 8 • 8 • 10 • 10 • 1 • 1 • Depth (km) • Depth (km) • 4 • 4 Comparison of PSKM and MD Images • X (km) • Prestack Kirchhoff Migration Image of • a North Sea Data Set • X (km) • MD Image
6 • 8 • 1 • Depth (km) • 4 Comparison of PSKM and MD Images KM MD • 6 8 • 1 • Depth (km) • 4 • Y(km) • Y (km)
X (km) • X (km) • X (km) • X (km) • 10 • 10 • 10 • 10 • 8 • 8 • 8 • 8 • 6 • 6 • 6 • 6 4 4 4 4 • 6 • 6 • 6 • 6 • Y (km) • Y (km) • Y (km) • Y (km) • 8 • 8 • 8 • 8 • Kirchhoff Image • MD Image Comparison of Depth Slices
X (km) • X (km) • X (km) • X (km) • 10 • 10 • 10 • 10 • 8 • 8 • 8 • 8 • 6 • 6 • 6 • 6 4 4 4 4 • 6 • 6 • 6 • 6 • Y (km) • Y (km) • Y (km) • Y (km) • 8 • 8 • 8 • 8 • Kirchhoff Image • MD Image Comparison of Depth Slices
4 • 4 • 6 • 6 • 8 • 8 • 10 • 10 • 1 • 1 • Depth (km) • Depth (km) • 4 • 4 Comparison of Decon and MD Images • X (km) • MD Image • X (km) • AGC + Harmonize + FXY decon image of the raw migration data
Depth (km) • 4 Comparison of Decon and MD Images AGC + Harmonize + FXY decon MD • 6 • 8 • 6 8 • 1 • 1 • Depth (km) • 4 • Y(km) • Y (km)
X (km) • X (km) • X (km) • X (km) • 10 • 10 • 10 • 10 • 8 • 8 • 8 • 8 • 6 • 6 • 6 • 6 4 4 4 4 • 6 • 6 • 6 • 6 • Y (km) • Y (km) • Y (km) • Y (km) • 8 • 8 • 8 • 8 • Harmon + FXY Decon Image • MD Image Comparison of Depth Slices
X (km) • X (km) • X (km) • X (km) • 10 • 10 • 10 • 10 • 8 • 8 • 8 • 8 • 6 • 6 • 6 • 6 4 4 4 4 • 6 • 6 • 6 • 6 • Y (km) • Y (km) • Y (km) • Y (km) • 8 • 8 • 8 • 8 Comparison of Depth Slices • Harmon + FXY Decon Image • MD Image
Results Comparison • X(km) • 0 • X(km) • 1 • 0 • 1 • 0 • 0 • Y(km) • Y(km) • 1 • 1 • 1 • Kirchhoff Migration Image • MD Image Deconvolved Migration Image MD Migration Decon Model Migration Image Conventional Deconvolution
Outline • Motivation • Solution • Numerical tests • Conclusions
Conclusions • Works on 2D and 3D migrated data, improves resolution, mitigates migration artifacts • Suitable for Kirchhoff and RTM migration images • Post-migration processing
Acknowledgement • Thank Phillips petroleum company and other UTAM sponsors • Thank Phillips petroleum company, Veritas marine surveys, Agip (UK) ltd., BG EP ltd., Centrica plc., Conoco UK ltd., Fina exploration ltd., and Phillips (UK) ltd., for granting permission to present the application of MD to gulf of Mexico and North Sea data set