Download
1 / 1
10 likes | 130 Vues
Measurements of Quantum Yields in Forest Canopy in Mixed-Species Natural Forest Liang Wei Department of Forest Resources STAT 507 Class Project, Instructor: Zaid Abdo . Fall, 2008.

E N D
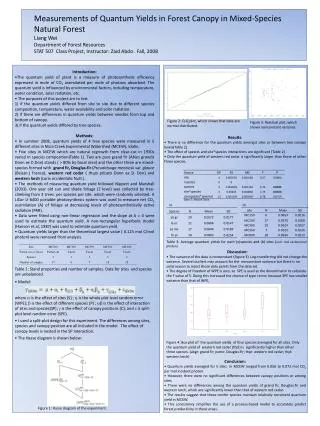
Measurements of Quantum Yields in Forest Canopy in Mixed-Species Natural Forest Liang Wei Department of Forest Resources STAT 507 Class Project, Instructor: ZaidAbdo . Fall, 2008 Introduction: •The quantum yield of plant is a measure of photosynthetic efficiency expressed in mole of CO2 assimilated per mole of photons absorbed. The quantum yield is influenced by environmental factors, including temperature, water condition, solar radiation, etc. • The purposes of this project are to test 1) if the quantum yields differed from site to site due to different species composition, temperature, water availability and solar radiation. 2) if there are differences in quantum yields between needles form top and bottom of canopy. 3) if the quantum yields differed by tree species. Methods: • In summer 2008, quantum yields of 4 tree species were measured in 5 different sites in Mica Creek Experimental Watershed (MCEW), Idaho. • Five sites in MCEW which are natural regrowth from clear-cut in 1930s varied in species composition(Table 1). Two are pure grand fir (AbiesgrandisDonn ex D.Don) stands ( > 80% by basal area) and the other three are mixed-species formed with grand fir, Douglas-fir (Pseudotsugamenziesii var. glauce (Beissn.) Franco), western red cedar ( thujaplicataDonn ex D. Don) and western larch (Larixoccidentalis Nutt.). • The methods of measuring quantum yield followed Nippert and Marshall (2003). One year old sun and shade foliage (2 level) was collected by tree-climbing from 3 trees. per species per site, which were randomly selected. A LiCor LI-6400 portable photosynthesis system was used to measure net CO2 assimilation (A) of foliage at decreasing levels of photosynthetically active radiation (PAR). • Data were fitted using non-linear regression and the slope at A = 0 were used to estimate the quantum yield. A non-rectangular hyperbolic model (Hanson et.al, 1987) was used to estimate quantum yield. • Quantum yields larger than the theoretical largest value ( 0.125 mol C/mol photon) were removed from analysis. Table 1: Stand properties and number of samples. Data for sites and species are unbalanced. • Model: where a is the effect of sites (S) ; h is the whole plot level random error (WPE); b is the effect of different species (P) ; ab is the effect of interaction of sites and species(SP); g is the effect of canopy positions (C); and e is split-plot level random error (SPE). • I used a split-plot design for this experiment. The differences among sites, species and canopy position are all included in the model. The effect of canopy levels is nested in the SP interaction. • The Hasse diagram is shown below: Results: • • There is no difference for the quantum yields amongst sites or between two canopy levels(Table 2). • • The effect of species and site*species interactions are significant (Table 2). • • Only the quantum yield of western red cedar is significantly larger than those of other three species. Figure 4: Box plot of the quantum yields of four species averaged for all sites. Only the quantum yield of western red cedar (thpl) is significantly higher than other three species. (abgr: grand fir; psme: Douglas-fir; thpl: western red cedar; thpl: western larch) Table 2: ANOVA Table . (a) (b) Table 3: Average quantum yields for each (a)species and (b) sites (unit: mol carbon/mol photon). Discussion: • • The variance of the data is nonconstant (Figure 3). Log-transferring did not change the variance. Several outliers may account for the nonconstant variancebut there is no solid reason to reject those data points from the data set. • • The degree of freedom of WPE is zero, so SPE is used as the denominator to calculate the F value of S. Doing this increased the chance of type I error, because SPE has smaller variance than that of WPE, Figure 2: Q-Q plot, which shows that data are normal distributed. Figure 3: Residual plot, which shows nonconstant variance. Figure 1: Hasse diagram of the experiment. Conclusion: • • Quantum yields averaged for5 sites in MCEW ranged from 0.056 to 0.072 mol CO2 per mol incident photon. • • However, there were no significant differences between canopy positionsor among sites. • • There were no differences among the quantum yields of grand fir, Douglas-fir and western larch, which are significantly lower than that of western red cedar. • • The results suggest that these conifer species maintain relatively consistent quantum yield in MCEW. • • This consistency simplifies the use of a process-based model to accurately predict forest productivity in these areas.