Download
1 / 35
360 likes | 858 Vues
Overview of Progress Monitoring for School Psychologists. Lisa Hartz, RtI Coach Emily Epstein, RtI Coach November 24, 2009. Concerns About Change in Role. School psychologists will not be needed if IQ testing is not mandated Without IQ-Achievement – will over-identify students with LD

E N D
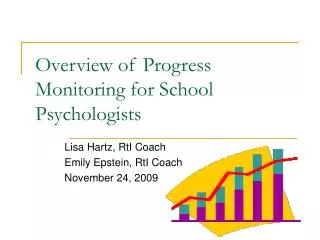
Overview of Progress Monitoring for School Psychologists Lisa Hartz, RtI Coach Emily Epstein, RtI Coach November 24, 2009
Concerns About Change in Role • School psychologists will not be needed if IQ testing is not mandated • Without IQ-Achievement – will over-identify students with LD – will lead to minority overrepresentation • Eliminating IQ test criteria will identify many slow learners as LD • Who will we be if not “gatekeepers”? Canter, A (2003) Viewpoint: Recommendation regarding LD identification: Fear Versus Data. NASP Communique May 2003, Vol 31 #7, p 9-10
Predicting the FutureFagan & Wise (2000) • “ The future is heavily related to being able to overcome the images of our past, but we must not lose sight of the fact that the school psychologist has been, and will continue to be, the best trained person in assessment in most educational communities. If our future is bright, then we will be perceived as among the best trained persons in interventions as well.”
RtI Implications for School Psychologists(Chidsey-Brown, 2005) • “School psychologists can enhance health by knowing about and using assessment and instructional support tools that foster academic competence” AND • “School psychologists who can design, implement, and evaluate RTI programs in their schools will be providing essential services to promote academic wellness among all students.”
Aimsweb MAP?? DIBELS Curriculum Based Evaluation (CBE) MAP Developmental Reading Assessment (DRA) Running Records Aimsweb DIBELS Direct observations ISAT MAP
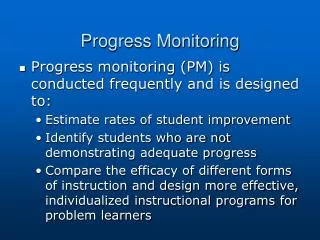
What is Progress Monitoring? • “A scientifically based practice that is used to assess students’ academic performance and evaluate the effectiveness of instruction” (1) • “The ongoing process of collecting and analyzing data to determine student progress toward specific skills on the IEP… or general outcomes as compared to grade-level norms and benchmarks”. (4) • “A set of techniques for assessing student progress on a regular and frequent basis” (5) • “When teachers assess students’ academic performance on a regular basis” (2)
Progress Monitoring Essential Steps • Selecting the measure and level of material • Measuring data • Establishing a performance standard • How to administer and score • How to graph scores • Setting a goal • How to apply decision rules to scores
Selecting the measure and level of material • Measures must be valid for intended purposes and uses • Select/develop measures that quickly assess skills (i.e. 1-2 mins) that directly reflect the instruction of the target skills • Generally, you will want to monitor with grade-level materials unless the student is achieving success more than 1 grade level below current grade placement • If a 4th grade student is successful (performs within the average range) in 3rd grade level material, monitor with 4th grade material • If a 5th grade student is successful (performs within the average range) in 3rd grade or lower material, monitor 1 level above instructional level
Example- Will, 2nd grade Score K-PSF K-NWF 1st 2nd
Selecting the measure and level of material-Examples • Curriculum Based Measurement • Kinder- Letter Naming Fluency, Nonsense Word Fluency, Phoneme Segmentation Fluency • 1st- Word Identification Fluency, Oral Reading Fluency • 2nd and above- Oral Reading Fluency*, MAZE * must be able to read at least 10 wrc in one minute • Classroom Assessments • Elementary: Letter Sounds, Dolch Words, Word Wall, Spelling Quizzes • Middle/Secondary: Unit tests, Quizzes
What other kinds of data can be collected? • Frequency or rate behavior occurs • Percentage, such as percentage correct • Duration of behavior • Latency of response to instruction • Quality of product/performance (how to quantify?) • Percentage of work completed w/in time allotted • “Mad Minute” assessments in math • DOL corrections w/in 5 minutes • Percentage of time in seat • Engaged time
Measuring Data • Frequency Recording- tally or count of the target behavior; use when behaviors have an obvious beginning and end • Where to find it: Work Samples, Assignment Notebooks, Report Cards, Checklists, Grade book • Examples of what can be counted: • Assignments completed, • Talk-outs, • Tardies, • Times raise hand, • Times out of Seat, • Absences
Measuring Data • Interval Recording- percent of time a behavior is/is not occurring; use when a behavior is continuous or when it occurs with extreme frequency • Where to find it: observations using momentary time-sampling • Examples: • Rocking in seat • Student engagement • Off-task
Measuring Data • Duration/Latency Recording- use when concern is exact length of time a student engages in target behavior • Where to find it: observations • Examples: • How long off-task • How long it takes student to follow a direction • Time it takes to complete test
Teachers Keeping Track of Data • Tally Sheets • Checks on chalkboard • Golf or knitting counters • Marbles or macaroni in a jar • Tallies on tape • Paper clips from one pocket to another
Establishing a Performance Standard • What are we comparing a student’s performance to? • Teacher Expectation • A 1st grade teacher expects students to put outdoor clothing in the appropriate place • A 7th grade teacher expects students to work quietly for an uninterrupted 30 minute period • Normed Performance • Students in 3rd grade in U-46, on average, earn a RIT score of XX in Reading in the Spring. • Peer Performance • Given a task, three average students complete task within 20 minutes. The target student takes 30 minutes. • School Policy/Standards • Students should be to school on time • Students should meet district academic standards
Why use performance standards? • Helpful to parents, team members, and teachers to see what the expectation is. • Helps us see how large the discrepancy is between the target student and standard. • Example: Michael’s median performance is 275 seconds between directions and initiation of task; Peers take 68 seconds. • Is there a discrepancy between target student and that of the designated standard? • Is the discrepancy large enough to suggest than an intervention should be tried?
Example- Will compared to classroom peers Words Read Correct
How to Administer and Score • Who Can Administer the Measures? • Classroom teacher • Classroom teaching assistant • Special education teacher • “Support” personnel - Psych, SW, SLP, etc. • Building administrator • Parent (if data needs to be collected at home - never at school!) • How Often?- General Rule • Tier 2: At least monthly • Tier 3: Weekly or bi-weekly As frequently as the problem intensity requires!
How to Administer and Score • Data collection tools and frequency may include… • CBM: 2 -3 times per week • Direct observation (B.O.S.S., etc.): frequency depends on the intensity and frequency of the concern • Structured interviews: pre- and post-intervention • Rating scales: usually pre- and post-intervention • Task analysis/error analysis: weekly, if possible • Classroom performance data: at least weekly
How to Graph Scores • What does it look like? • Horizontal axis indicates time frame. • Vertical axis indicates the amount measured or observed. Scores Week of
How to Graph Scores • Baseline data • Help you define the problem • Tell you intensity of the behavior • Tell you the initial performance discrepancy • Allow you to evaluate intervention effectiveness • Typically, 3-5 data points Baseline
How to Graph Scores • Aimline (Goal line) • A line connecting the median baseline score with the target performance criterion (goal). • Trendline • A line of best fit through a student’s data points (does not include baseline data!). • Can be compared against the aimline to help inform responsiveness to intervention and to tailor a student’s instructional program.
Setting a Goal • A sensible/reasonable goal should take into account: • Magnitude of discrepancy • Characteristics of the student • Difficulty of task • Amount of time available for intervention (number of learning opportunities)
Setting a Goal- Three Options • Universal Benchmark- Example: Students in the 2nd grade should be reading 68 words per minute correct in winter • Rate of Improvement (ROI)- Example: Using grade-level expected growth rate x number of weeks and adding this to current baseline. (1.5 x 34 wks) + 50= 101 • Intra-individual Framework – Example: Identify a student’s ROI using at least eight data points. If a student was reading 77 wrc and is now reading 89 wrc, the slope is .86. Multiply the slope by 1.5 and that will give you a rate of improvement of 1.3. That ROI is multiplied by the number of weeks remaining. In this example 1.3 times 27 weeks remaining = 35 words. Add 35 to the baseline of 77 and the goal is 112 words per minute correct by the end of the stated time period.
Setting a Goal Goals for Rate of Improvement (ROI) Reading CBM GradeReasonableAmbitious 1 2.0 3.0 2 1.5 2.0 3 1.0 1.5 4 0.85 1.1 5 0.50 0.85 6 0.30 0.65 Fuchs et. al 2003
How to apply decision rules to scores • Most common approach is the “4 point data” rule • If the 4 most recent data points are all ABOVE the goal line, keep the current intervention and increase the goal • If the 4 most recent data points are all BELOW the goal line, keep the current goal and modify the intervention • If the 4 data points are both above and below the goal line, maintain the current goal and intervention and continue collecting/reviewing data
How to apply decision rules to scores • Aimline-trendline comparison, part 1 • If slope of trendline is equal to slope of aimline, continue with intervention AL TL
How to apply decision rules to scores • Aimline-trendline comparison, part 2 • If slope of trendline is less than the slope of aimline, consider an instructional change • More direct or intensive instruction • Re-teach prerequisite skills • Increase opportunities to practice and respond AL TL
How to apply decision rules to scores • Aimline-trendline comparison, part 3 • If slope of trendline is greater than the slope of aimline, consider raising the goal TL AL
Practice • Chart Dog 2.0 • Excel • Hand Graphs