Download
1 / 43
480 likes | 1.07k Vues
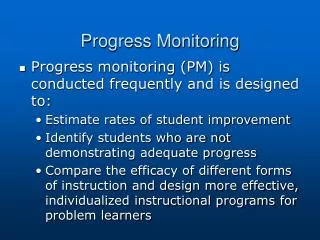
Progress Monitoring. Module 6 RI RTI Initiative 2007. Topics of Session. Progress Monitoring Assessment Importance of graphs Decision Rules: Performance Level Setting Goals Decision Rules: Response rate to instruction. District/School Level (Benchmarking/Screening)

E N D
Progress Monitoring Module 6 RI RTI Initiative 2007
Topics of Session • Progress Monitoring Assessment • Importance of graphs • Decision Rules: Performance Level • Setting Goals • Decision Rules: Response rate to instruction
District/School Level (Benchmarking/Screening) To screen and identify students who are at-risk and in need of interventions All students Three times a year All areas At grade-level Intervention Level To monitor progress of individual students and determine rate of improvement and need for adaptation of intervention Students who are not achieving benchmarks (PLP, IEP) Weekly, biweekly, monthly assessments In area of need At instructional level Assessment in a RTI ModelProgress Monitoring
Activity One What can this data tell you? TURN AND TALK A Picture is worth a thousand words....
Decision Making: Performance Levels • Who needs intervention support? • 3 ways • Percentiles • Cut Points • Discrepancy ratio
Percentiles Requires a Larger Normative Data Base, Preferably Benchmark Data < 25th At Risk, Consider Problem-Solving at the Group Level <10th Potential Severe Problem, Consider Individual Problem Solving
Cut Scores • A number which represents the point at which scores can be divided into different groups (for example does not meet, meets, and exceeds expectations) for decision-making purposes. • May be based on research (e.g., a correlation between scoring at or above a certain level on a CBM or DIBELS task and future academic success) or expectation (e.g., grades at C or above, no more than 3 office referrals).
How to calculate: Discrepancy Ratios • Sample 5-7 Students or Whole Class, Grade • Figure Median and Graph • Divide by 2 and Graph • Students Who Perform Below the Line May Need Problem Solving
Can Compute… Peer Median Target Student Median 145 40 = Discrepancy of 3.6x
Data-based decisions on performance level enables team to make decisions about levels of support and resource from the start. Generally speaking… - A student who is 1.5x discrepant from his/her peers may benefit from intensive group interventions. • A student who is 2-2.5x discrepant from his/her peers is appropriate for individualized problem-solving and intensive intervention resources may be appropriate. Example: Jessica is 2.1x discrepant from peers on the Math CBM and may benefit from intensive interventions in math.
median 2x discrepant Who needs intervention support?
Data-Based Decisions • Performance Level • Gaps in Performance • PLP Not at Grade Level • Special Education Significant Discrepancy • Progress Monitoring • Rate of Learning • Trend in performance • Response to Instruction
2. Rate of Learning • Why? • Is what we are doing working?.... intervene early • Better able to predict student success at meeting goals • Better able to identify who needs more intensive instruction
Measure of Progress…rate of learning Curriculum-Based Assessment • Portfolio • Work Samples • Mastery Measurement • Curriculum-Based Measurement
Progress Monitoring CBMs • Are assessments to monitor progress • Are designed to serve as “indicators” of general reading/math achievement. CBM doesn’t measure everything, but measures the importantthings. • Are Standardized teststo be given, scored, and interpreted in a standard way. • Are researchedwith respect to psychometric properties to ensure accurate measures of learning. • Are Sensitive to improvement in Short Periods of time. • Designed to be as short as possible to ensure its “do ability.” • Are linked to decision making for promoting positive achievement and Problem-Solving
Word Identification Fluency www.interventioncentral.org
Math Computation Taken from Fuchs, L. S., Hamlett, C. A., & Fuchs, D. (1998). Monitoring Basic Skills Progress: Basic Math Computation (2nd ed.). [computer program]. Austin, TX: ProEd. Available: from http://www.proedinc.com
Concepts and Applications Sample page from a three-page test for Grade 2 Math Concepts and Applications • From Monitoring Basic Skills Progress
Vocabulary Matching • To assess learning in the content areas • Middle and High School
Progress Monitoring National Center on Student Progress Monitoring www.studentprogress.org
Progress Monitoring Benefits of Progress Monitoring • Parents and students know what is expected • Teachers know what is working or not working with their instruction based on data • Easy to understand way to show parents progress • Teams have comprehensive data on student performance for decision making
Setting Goals and Response to Instruction • Setting Goals • Benchmarks • Rate of Improvement (ROI) norms • Intra-individual • Decision Making Rules: Response rate to instruction • Data Point Rules • Trend Line Rules • Rate of Improvement (ROI) Slope
Setting Goals • End of the Year Benchmarks • GLEs for Reading Fluency • 2nd grade 80-100 WPM • 5th grade 125-150 WPM • WIF • 50 words per minute • AIMSweb Math Computation Norms • 1st grade 17 Correct Digits • 5th grade 52 Correct Digits
Research Norms for Improvement MATH CALCULATIONS* *Fuchs, 2006 READING FLUENCY** **Deno, 2005
Intraindividual ROI • Weekly rate of improvement in “baseline slope” calculated from 8 data points (Slope: Difference of highest and lowest/#weeks) • Baseline multiplied by 1.5 • Product multiplied by number of weeks until end of year • Add to student’s final baseline score to produce end of year goal. Baseline Reading scores: 52, 54, 52, 53, 55, 58, 55, 56 Difference: 58-52 =5 Divide by number of weeks: 5/8 =.625 (SLOPE) Baseline multiplied by 1.5: .625 × 1.5 = .9375 Number of weeks left (6 weeks): .9375 ×6 =5.6 Add to final baseline score: 56+5.6 = 61.6 GOAL 62
Carlos – 5th grader What math goal would you set for Carlos for the end of year -- 18 weeks from now? Math Calculation December-January Monitoring 36, 37, 36, 36, 37, 38, 39, 37
What goal would you set for Carlos in math for the end of year? Carlos – 5th grader End of Year Benchmarks 52 CD (.77 ROI) National Norms 51 CD (.7 ROI) (38+18*.7) 58 CD (1.1 ROI) (38+18*1.1) Individual ROI 48 CD (.56 ROI) 3/8*1.5 =.56 ROI 38 + (18*.56)
Decision Making: Response rate to instruction • Data Points • Trend Analysis • ROI – Using Tukey to Find Slope
Decisions based on data-points Derived from: Fuchs and Fuchs (2006) and Shapiro (2006)
Decisions based on trend lines Trend lines based on 6-8 data-points • If trend line is steeper than goal line, increase the goal. • If trend line is flatter than goal line, revise instruction • If trend line equals goal line, make no change at this time. AIMLINE TREND
Bob: Did he respond? Trend
Tukey Method for Finding Slope • Step 1: Divide the data points into three equal sections by drawing two vertical lines. (If the points divide unevenly, then group them approximately.) • Step 2: In the first and third sections, find the median data point and median instructional week. Locate the place on the graph where the two values intersect and mark that spot with an X. • Step 3: Draw a line through the two Xs and extend that line to the margins of the graph. This represents the trend-line or line of improvement. • Step 4: Calculating Slope • Third median point – First median point • Number of data points – 1
Sample to practice Tukey X X 20-14 12-1 6 11 .55 slope ROI
Is Carlos responding to the intervention?
End of March: 8 Week Check-In CHANGE INTERVENTION X X
June: Did Carlos meet the goal? INTERVENTION CHANGE X X
When making decisions you can be informed by data or driven by data. TURN AND TALK • What is the difference between data-driven and data informing? • What are your current practices for decision making? • What do you need to do to use data to more effectively meet students' needs?
3 - 2 - 1 3 things you learned today 2 things you still have questions about 1 statement about how you feel about PM now