Progress Monitoring
240 likes | 447 Vues
Progress Monitoring. project DATA Assessment Module. Agenda. Project map Assessment in an RTI framework Summative ( not a focus in this session ) Formative Screening: check your results Progress Monitoring: review 1st probe Procedural logistics check-in Closing activities.

Progress Monitoring
E N D
Presentation Transcript
Progress Monitoring projectDATA Assessment Module
Agenda • Project map • Assessment in an RTI framework • Summative (not a focus in this session) • Formative • Screening: check your results • Progress Monitoring: review 1st probe • Procedural logistics check-in • Closing activities www.uoregon.edu/~projdata
projectDATA Map www.uoregon.edu/~projdata
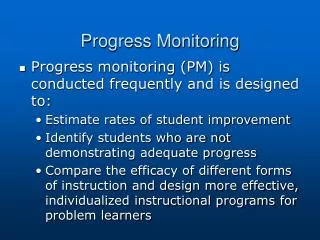
Essential Components of RTI • Scientifically Based, Preventative Instruction • Evidence-based core instruction • Early Identification • Utilize universal screening • Intervention • Implement and track interventions for students making insufficient progress • Monitor Progress Formatively • Use formative, ongoing assessment to monitor student progress • Data-based Decisions • Use data to guide instructional decisions www.uoregon.edu/~projdata
Assessment in an RTI Framework • Multiple forms of assessment needed to answer specific instructional questions • Summative, formative • Assessment results can be used to identify the level of instructional intervention needed: • Benchmark: Students making adequate progress toward goal; no additional support needed • Strategic: Students at risk for difficulties; need immediate intervention to prevent additional difficulty • Intensive: Students with significant difficulties; need urgent and intensive support www.uoregon.edu/~projdata
Intensive 1-5% Strategic 5-10% Benchmark 80-90% Three-tier Model www.uoregon.edu/~projdata
Screening Assessment • Purpose and design of test: • Screening for student difficulty with broad skills • 25 computation items • 25 application items • Technical adequacy: • Content review by teachers • Statistical analyses • To access the results of screening : • Website and login information • Time to get on computers… www.uoregon.edu/~projdata
Enter Username Student Login: Teacher Username Enter Password easyCBM Login • http://data.or.easycbm.com/ www.uoregon.edu/~projdata
Home Tab www.uoregon.edu/~projdata
Reports Tab Click on Individuals, then select student name to view student progress/score. Click on test for report; scroll down to see student roster with scores for each test. www.uoregon.edu/~projdata
Screening Assessment Results • What did you notice about your class results? • If you assessed more than one class, how did your classes compare? • How do your classes compare to district information (if available)? • What does this information tell you about individual student needs? • How can you use this information for instructional planning and delivery? www.uoregon.edu/~projdata
Screening Identifies level of risk Criterion-based Indicates student skill in a broad area (e.g., computation, problem-solving) Provides data to support teachers in identifying students who may need additional support or assessment Progress Monitoring Measures growth Individually-referenced Provide a snapshot of student performance in a focused skill area Sensitive to small changes in student performance Data frequently graphed to assist decisions projectDATA Assessment Focus www.uoregon.edu/~projdata
What Screening and CBM are not… • Curriculum-embedded assessments • Do not look at student skill relative to objectives in the curriculum • Representative of all of a student’s knowledge/skill in mathematics • Probes are brief measures of several skills • Sufficient for measuring mastery of skill • Probes support formative evaluation of student performance relative to desired outcomes www.uoregon.edu/~projdata
General Features of Math CBMs • Content sampled from across the curriculum • Number and proportion of items representing each subskill is consistent across forms • Items are arranged in random order • Standard probe includes 25 items, 1 page • Administration is timed (average 4 minutes) • Typically group administered • Scores are usually calculated by counting correct digits • Difficulty of probes are constant across the year www.uoregon.edu/~projdata
Progress Monitoring in Mathematics • Many progress monitoring measures emphasize computational skills, foundational to more advanced skills • Strong computational skills leads to increased likelihood that students will experience success with more complex math topics • Fluency measures (e.g, CBM) support the assessment of student automaticity with material • Automaticity with basic skills is essential to reduce cognitive load while learning complex mathematic concepts www.uoregon.edu/~projdata
Research Support for Progress Monitoring • Allows educators to make informed decisions about the effectiveness of instruction (Deno, 1992) • Use of data leads to more immediate, appropriate program changes (Shinn, Shinn, Hamilton, & Clarke, 2002) • Need for students to be quick and efficient in basic skills (National Research Council, 2001; Shinn & Bamonto, 1998) • Research has focused on creating valid, reliable progress monitoring measures (e.g., DIBELS and CBM) • Academic achievement can be improved by monitoring progress, graphing progress, adding decision rules, and setting ambitious goals (Fuchs & Fuchs, 1986) www.uoregon.edu/~projdata
Progress Monitoring Results • What do you notice about student scores? • What information can you glean from student performance? • Are there areas where students need support? • What strategies can you use to address skill deficits? www.uoregon.edu/~projdata
Scoring Student Responses • Evaluate the response: • Correct digit or correct representation • Digit is formed correctly and legible • Correct place value • Calculate the total number of correct digits per minute (CD) 3/3 2/2 3/3 0/5 4/5 Total digits correct: 12/18 www.uoregon.edu/~projdata
Progress Monitoring Procedures • Identify standards for student performance • Screen to identify students at-risk for falling below the standard • Determine a baseline score and set a goal or aim for each student (e.g., ambitious or realistic, draw aimline) • Implement a progress monitoring schedule based on the frequency of data desired • Use the data to inform instruction and implement interventions where needed • Update progress monitoring schedule to reflect changes in need for data www.uoregon.edu/~projdata
Using Data to Determine Goals Steps: • Gather baseline & performance data • October and November • Set student performance goals • December • Monitor progress toward goals • Ongoing • Adjust or modify instruction as needed • Winter focus www.uoregon.edu/~projdata
Procedural Logistics Now that you’ve given probes… • What worked? • What didn’t work? • How can process be improved next week? www.uoregon.edu/~projdata
Closing Activities • Evaluation • Questions? • Next meeting • December 2 • Continue to collect progress monitoring data • Other tasks? www.uoregon.edu/~projdata