Download

1 / 94
940 likes | 1.07k Vues
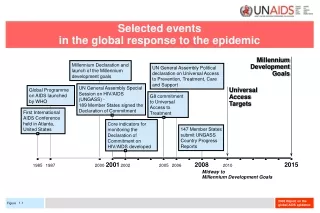
Selected events in the global response to the epidemic. Millennium Development Goals. Millennium Declaration and launch of the Millennium development goals. UN General Assembly Political declaration on Universal Access to Prevention, Treatment, Care and Support.

E N D
Selected events in the global response to the epidemic Millennium Development Goals Millennium Declaration and launch of the Millennium development goals UN General Assembly Political declaration on Universal Access to Prevention, Treatment, Care and Support UN General Assembly Special Session on HIV/AIDS (UNGASS) - 189 Member States signed the Declaration of Commitment Global Programme on AIDS launched by WHO Universal Access Targets G8 commitment to Universal Access to Treatment First International AIDS Conference held in Atlanta, United States Core indicators for monitoring the Declaration of Commitment on HIV/AIDS developed 147 Member States submit UNGASS Country Progress Reports 2001 2008 2015 1985 1987 2000 2002 2005 2006 2010 Midway to Millennium Development Goals 1.1
FIRST OF 2 PARTS: National indicators for the implementation of the Declaration of Commitment on HIV/AIDS National Commitment and Action 1 Domestic and international AIDS spending by categories and financing sources 2 National Composite Policy Index (Areas covered: gender, workplace programmes, stigma and discrimination, prevention, care and support, human rights, civil society involvement, and monitoring and evaluation) National Programmes(Blood safety, antiretroviral therapy coverage, prevention of mother-to-child transmission, co-management of TB and HIV treatment, HIV testing, prevention programmes, services for orphans and vulnerable children, and education) 3 Percentage of donated blood units screened for HIV in a quality assured manner 4 Percentage of adults and children with advanced HIV infection receiving antiretroviral therapy 5 Percentage of HIV-positive pregnant women who received antiretrovirals to reduce the risk of mother-to-child transmission 6 Percentage of estimated HIV-positive incident TB cases that received treatment for TB and HIV 7 Percentage of women and men aged 15-49 who received an HIV test in the last 12 months and who know their results 8 Percentage of most-at-risk populations that have received an HIV test in the last 12 months and who know their results 9 Percentage of most-at-risk populations reached with HIV prevention programmes 10 Percentage of orphaned and vulnerable children aged 0–17 whose households received free basic external support in caring for the child 11 Percentage of schools that provided life skills-based HIV education in the last academic year National Indicators National Indicators 1a
LAST OF 2 PARTS: National indicators for the implementation of the Declaration of Commitment on HIV/AIDS Knowledge and Behaviour 12 Current school attendance among orphans and among non-orphans aged 10–14* 13 Percentage of young women and men aged 15–24 who both correctly identify ways of preventing the sexual transmission of HIV and who reject major misconceptions about HIV transmission* 14 Percentage of most-at-risk populations who both correctly identify ways of preventing the sexual transmission of HIV and who reject major misconceptions about HIV transmission 15 Percentage of young women and men aged 15–24 who have had sexual intercourse before the age of 15 16 Percentage of women and men aged 15–49 who have had sexual intercourse with more than one partner in the last 12 months 17 Percentage of women and men aged 15–49 who had more than one sexual partner in the past 12 months reporting the use of a condom during their last sexual intercourse* 18 Percentage of female and male sex workers reporting the use of a condom with their most recent client 19 Percentage of men reporting the use of a condom the last time they had anal sex with a male partner 20 Percentage of injecting drug users reporting the use of a condom the last time they had sexual intercourse 21 Percentage of injecting drug users reporting the use of sterile injecting equipment the last time they injected Impact 22 Percentage of young women and men aged 15–24 who are HIV infected* 23 Percentage of most-at-risk populations who are HIV infected 24 Percentage of adults and children with HIV known to be on treatment 12 months after initiation of antiretroviral therapy 25 Percentage of infants born to HIV-infected mothers who are infected National Indicators National Indicators * Millennium Development Goals indicator 1b
Percentage of UN member states reporting by region, 2004–2008 Year of reporting (UN Member States reporting/total number of UN Member States) 2006 (122/191) 2008 (147/192) 2004 (102/189) 100 80 60 % 40 20 0 Caribbean (13) Latin America (20) Eastern Europe and Central Asia (19) Sub- Saharan Africa (47) South and South- East Asia (20) East Asia (5) Oceania (14) Western and Central Europe (32) North America (2) North Africa and Middle East (20) (total number of UN Member States in the region) Source: UNGASS Country Progress Reports 2008. 1.2
Percentage of countries with Monitoring and Evaluation components in place, 2005 and 2007 2005 2007 100 80 60 Percentage of countries (%) 40 20 0 One national Monitoring and Evaluation plan is available The Monitoring and Evaluation plan is endorsed by key partners The Monitoring and Evaluation plan has associated budget Funding of Monitoring and Evaluation is secured A functional National Monitoring and Evaluation unit is present A central HIV database is present Source: UNGASS Country Progress Reports 2008. 1.3
Global trends in monitoring and evaluation system strengthening, 2005 and 2007 2005 basic elements* in place one or more basic elements* missing 2007 no trend data available * One national monitoring and evaluation plan including budgetary requirements and with funding secured; a functional national monitoring and evaluation unit and/or monitoring and evaluation working group; a central national HIV database. Source: UNGASS Country Reports 2006, 2008. 1.4
Selected events in tracking the epidemic Millennium Development Goals Guidelines on second generation HIV surveillance As of 2007, 31 countries have conducted population-based surveys with HIV prevalence measurement Global Programme on AIDS launched by WHO First Demographic and Health Surveys with HIV prevalence measurement in Mali and Zambia Universal Access Targets First Reference Group on Estimates, Modelling and Projections meeting The first HIV antibody test becomes available First global series of regional training workshops on estimation methods for national epidemics 2001 2008 2015 1985 1987 1998 2000 2003 2007 2010 Midway to Millennium Development Goals UN General Assembly Special Session on HIV/AIDS June 2001/ 189 Member States signed the Declaration of Commitment 2.1
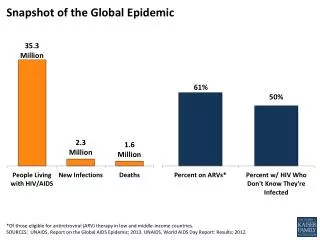
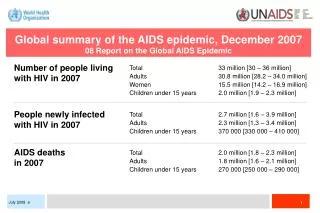
A global view of HIV infection 33 million people [30–36 million] living with HIV, 2007 2.2
FIRST OF 3 PARTS: Analysis of trends among 15–24-year-olds in high prevalence countries (all countries with national prevalence that exceeded 3% and 4 additional countries in Africa with notable prevalence levels): HIV prevalence among pregnant women (2000–2007) in sentinel surveillance systems, and selected sexual behaviours among women and men (1990–2007) from national surveys NOTES: [1] Highlighted cellsindicate positive trends in prevalence or behaviour. [2]* Consistent sites only were used in the analysis of change in HIV prevalence over time, for a minimum of three years. Significance test based on H0: slope =0 LEGEND: [a]Prevalence obtained from pregnant women attending antenatal clinics in selected. [b]Among 15–19 years olds, proportion reported having had sex by age 15. Analyses based on DHS, MICS or national surveys conducted between 1990 and 2007. [c]Among 15–24 years olds, proportion reported having had sex with more than one partner in the last 12 months. Analyses based on data from repeat DHS or national surveys conducted between 1990 and 2007. [d]Among 15–24 years olds, proportion of those with more than one partner reporting having used a condom the last time they had sex. Analyses based on data from repeat DHS or national surveys conducted between 1990 and 2007. [Ù]Observed increase in HIV prevalence or behaviour. [Ú]Observed decrease in HIV prevalence or behaviour. [Ú*]Statistically significant decrease in HIV prevalence of more than 25% or significant decrease in measured behavioural indicator. Analysis of prevalence based on regression analysis; analysis of behaviour based on Chi-square or Chi-square test for trend. [Ù*]Statistically significant increase in measured behavioural indicator. Analysis of behaviour based on Chi-square or Chi-square test for trend. [↔]No evidence of change. [ID]Insufficient data, i.e. less than three years of data received. 2a
SECOND OF 3 PARTS: Analysis of trends among 15–24-year-olds in high prevalence countries (all countries with national prevalence that exceeded 3% and 4 additional countries in Africa with notable prevalence levels): HIV prevalence among pregnant women (2000–2007) in sentinel surveillance systems, and selected sexual behaviours among women and men (1990–2007) from national surveys NOTES: [1] Highlighted cellsindicate positive trends in prevalence or behaviour. [2]* Consistent sites only were used in the analysis of change in HIV prevalence over time, for a minimum of three years. Significance test based on H0: slope =0 LEGEND: [a]Prevalence obtained from pregnant women attending antenatal clinics in selected. [b]Among 15–19 years olds, proportion reported having had sex by age 15. Analyses based on DHS, MICS or national surveys conducted between 1990 and 2007. [c]Among 15–24 years olds, proportion reported having had sex with more than one partner in the last 12 months. Analyses based on data from repeat DHS or national surveys conducted between 1990 and 2007. [d]Among 15–24 years olds, proportion of those with more than one partner reporting having used a condom the last time they had sex. Analyses based on data from repeat DHS or national surveys conducted between 1990 and 2007. [Ù]Observed increase in HIV prevalence or behaviour. [Ú]Observed decrease in HIV prevalence or behaviour. [Ú*]Statistically significant decrease in HIV prevalence of more than 25% or significant decrease in measured behavioural indicator. Analysis of prevalence based on regression analysis; analysis of behaviour based on Chi-square or Chi-square test for trend. [Ù*]Statistically significant increase in measured behavioural indicator. Analysis of behaviour based on Chi-square or Chi-square test for trend. [↔]No evidence of change. [e]Semi-urban and urban areas were combined in analysis of urban data. [f] Analysis in Mozambique combined for South, North and Central. 2b
LAST OF 3 PARTS: Analysis of trends among 15–24-year-olds in high prevalence countries (all countries with national prevalence that exceeded 3% and 4 additional countries in Africa with notable prevalence levels): HIV prevalence among pregnant women (2000–2007) in sentinel surveillance systems, and selected sexual behaviours among women and men (1990–2007) from national surveys NOTES: [1] Highlighted cellsindicate positive trends in prevalence or behaviour. [2]* Consistent sites only were used in the analysis of change in HIV prevalence over time, for a minimum of three years. Significance test based on H0: slope =0 LEGEND: [a]Prevalence obtained from pregnant women attending antenatal clinics in selected. [b]Among 15–19 years olds, proportion reported having had sex by age 15. Analyses based on DHS, MICS or national surveys conducted between 1990 and 2007. [c]Among 15–24 years olds, proportion reported having had sex with more than one partner in the last 12 months. Analyses based on data from repeat DHS or national surveys conducted between 1990 and 2007. [d]Among 15–24 years olds, proportion of those with more than one partner reporting having used a condom the last time they had sex. Analyses based on data from repeat DHS or national surveys conducted between 1990 and 2007. [Ù]Observed increase in HIV prevalence or behaviour. [Ú]Observed decrease in HIV prevalence or behaviour. [Ú*]Statistically significant decrease in HIV prevalence of more than 25% or significant decrease in measured behavioural indicator. Analysis of prevalence based on regression analysis; analysis of behaviour based on Chi-square or Chi-square test for trend. [Ù*]Statistically significant increase in measured behavioural indicator. Analysis of behaviour based on Chi-square or Chi-square test for trend. [↔]No evidence of change. [ID]Insufficient data, i.e. less than three years of data received. [ND] Data not received. [g]No data received in response to working group process; analyses based on data in South Africa surveillance report. [h]No data received in response to working group process; analyses based on data reported in Zambia 2005 surveillance report. Analysis based on urban and rural data combined. 2c
Estimated number of people living with HIV and adult HIV prevalence Global HIV epidemic, 1990–2007; and, HIV epidemic in Sub-Saharan Africa, 1990–2007 Global HIV epidemic, 1990–2007 HIV epidemic in Sub-Saharan Africa, 1990–2007 Number of people living with HIV (millions) % HIV prevalence, adult (15–49) Number of people living with HIV (millions) % HIV prevalence, adult (15–49) 40 4.0 30 15.0 25 12.0 30 3.0 20 9.0 20 2.0 15 6.0 10 10 1.0 3.0 5 0 0 0 0 1990 ‘91 ‘92 ‘93 ‘94 ‘95 ‘96 ‘97 ‘98 ‘99 2000 ‘01 ‘02 ‘03 ‘04 ‘05 ‘06 2007 1990 ‘91 ‘92 ‘93 ‘94 ‘95 ‘96 ‘97 ‘98 ‘99 2000 ‘01 ‘02 ‘03 ‘04 ‘05 ‘06 2007 NOTE: Even though the HIV prevalence stabilized in Sub-Saharan Africa, the actual number of people infected continues to grow because of ongoing new infections and increasing access to antiretroviral therapy. Number of people living with HIV % HIV prevalence, adult (15–49) These bars indicate the range around the estimate 2.3
70 Sub-Saharan Africa 60 GLOBAL 50 Percent female (%) Caribbean 40 Asia 30 Latin America 20 Eastern Europe & Central Asia 10 0 1990 ‘91 ‘92 ‘93 ‘94 ‘95 ‘96 ‘97 ‘98 ‘99 2000 ‘01 ‘02 ‘03 ‘04 ‘05 ‘06 2007 Percent of adults (15+) living with HIV who are female 1990–2007 2.4
2.5 Millions 2.0 1.5 1.0 0.5 0 1990 1991 1992 1993 1994 1995 1996 1997 1998 1999 2000 2001 2002 2003 2004 2005 2006 2007 Year This bar indicates the range around the estimate Children living with HIV globally, 1990–2007 2.5
600 000 500 000 400 000 300 000 200 000 100 000 0 1990 1991 1992 1993 1994 1995 1996 1997 1998 1999 2000 2001 2002 2003 2004 2005 2006 2007 Year This bar indicates the range around the estimate New HIV infections among children, 1990–2007 2.6
500 000 400 000 300 000 200 000 100 000 0 1990 1991 1992 1993 1994 1995 1996 1997 1998 1999 2000 2001 2002 2003 2004 2005 2006 2007 Year This bar indicates the range around the estimate Child deaths due to AIDS, 1990–2007 2.7
HIV prevalence (%) among pregnant women attending antenatal clinics in sub-Saharan Africa, 1997–2007 Southern Africa Botswana 50 Burkina Faso Lesotho 40 Mozambique 30 Namibia NOTE: Analysis restricted to consistent surveillance sites for all countries except South Africa (by province) and Swaziland (by region) Median HIV prevalence (%) 20 South Africa Ghana Swaziland 10 Zimbabwe 0 1997– 1998 1997– 1998 1997– 1998 1999– 2000 1999– 2000 1999– 2000 2001 2001 2001 2002 2002 2002 2003 2003 2003 2004 2004 2004 2005 2005 2005 2006 2006 2006 2007 2007 2007 Eastern Africa West Africa 20 20 15 15 Ethiopia 10 10 Median HIV prevalence (%) Median HIV prevalence (%) Côte d'Ivoire 5 5 Kenya Senegal 0 0 2.9 Source: National surveillance reports and UNAIDS/WHO/UNICEF, Epidemiological Fact Sheets on HIV and AIDS. July 2008.
HIV prevalence (%) among 15–24 years old, by sex, selected countries, 2005–2007 Swaziland South Africa Zimbabwe Central African Republic Uganda Female Chad Côte d'Ivoire Male Sierra Leone Rwanda Haiti Guinea Ethiopia Benin Mali DR Congo Niger Dominican Republic Senegal Cambodia India 0 5 10 15 20 25 % HIV prevalence Source: Demographic and Health Surveys and other national population-based surveys with HIV testing. 2.10
90 80 Western Europe Asia 70 Southern Africa Western Africa 60 Years Eastern Africa 50 Central Africa 40 30 1950– 1955 1955– 1960 1960– 1965 1965– 1970 1970– 1975 1975– 1980 1980– 1985 1985– 1990 1990– 1995 1995– 2000 2000– 2005 2005– 2010 Life expectancy at birth, selected regions, 1950–1955 to 2005–2010 Source: Population Division of the Department of Economic and Social Affairs of the United Nations Secretariat, World Population Prospects: The 2006 Revision, http://esa.un.org/unpp 2.11
Ghana 1950 2007 100+ Male Female Male Female 80 60 Age 40 20 0 10 5 0 5 10 10 5 0 5 10 Percentage Percentage Lesotho 1950 2007 100+ Male Female Male Female 80 60 Age 40 20 0 10 5 0 5 10 10 5 0 5 10 Percentage Percentage Changes in population structure: Ghana and Lesotho Source: Population Division of the Department of Economic and Social Affairs of the United Nations Secretariat, World Population Prospects: The 2006 Revision, http://esa.un.org/unpp 2.12
FIRST OF 3 PARTS: HIV prevalence among injecting drug users, men having sex with men, and female sex workers in Pakistan, 2004–2007 Injecting drug users 60 51.3 50 40 30 29.8 30 % 27 23 19.6 20 16.5 13 13.3 10 9.5 9 10 6.5 5.3 3.7 2.2 0.5 0.5 0 0 0 2004 2005 2006 2006 2006 2005 2006 2005 2006 2004 2005 2006 2004 2005 2006 2005 2006 2007 2005 2006 Karachi Larkana Faisalabad Rawalpindi Quetta Sukker Hyderabad Sargodha Lahore Peshawar Source: Ministry of Health Pakistan. HIV Second Generation Surveillance in Pakistan, National Report Rounds I and II. 2.14a
SECOND OF 3 PARTS: HIV prevalence among injecting drug users, men having sex with men, and female sex workers in Pakistan, 2004–2007 Men having sex with men 20 Male sex workers Hijras 16 14.0 *Cities with single or multiple years 0% HIV prevalence: Sukker (MSW: 2005, 2006); Hyderabad (MSW: 2005); Rawalpindi (MSW & Hijras: 2004, 2005, 2006); Lahore (MSW: 2004, 2005, 2006); and, Quetta (MSW: 2004, 2005, 2006) 12 % 7.5 8 4.5 4 4 2.5 2.5 2.0 2 1.7 1.5 1 0.9 0.9 0.5 0.5 0.5 0.5 0.5 0 0 0 0 0 0 0 0 0 0 0 0 2005 2004 2005 2006 2004 2006 2006 2006 2005 2006 2005 2007 2005 2006 2005 2005 2006 2005 2006 2006 2006 2007 2005 2006 2004 2005 2004 2005 2006 Sukker Hyderabad Karachi Larkana Faislabad Sargodha Lahore Quetta Peshawar Source: Ministry of Health Pakistan. HIV Second Generation Surveillance in Pakistan, National Report Rounds I and II. 2.14b
LAST OF 3 PARTS: HIV prevalence among injecting drug users, men having sex with men, and female sex workers in Pakistan, 2004–2007 Female sex workers 5 *Cities with single or multiple years 0% HIV prevalence: Larkana (2006); Faisalabad (2005, 2006); Sargodha (2005, 2006); Rawalpindi (2004, 2005, 2006); and Peshawar (2005, 2006) 4 3 % 2 1 0.7 0.7 0.5 0.3 0.3 0 0 0 0 0 0 0 2004 2005 2006 2005 2006 2005 2006 2005 2006 2004 2005 Karachi Sukker Hyderabad Lahore Quetta Source: Ministry of Health Pakistan. HIV Second Generation Surveillance in Pakistan, National Report Rounds I and II. 2.14c
Projected total number of HIV infections in various population groups, in Jakarta, Indonesia, 2000–2020 200 000 IDUs with HIV Wives of IDU with HIV Other heterosexuals infected with HIV in a chain originating with IDU 160 000 120 000 80 000 Number of HIV infections 40 000 0 2000 2001 2002 2003 2004 2005 2006 2007 2008 2009 2010 2011 2012 2013 2014 2015 2016 2017 2018 2019 2020 Source: Asian Epidemic Model projections using Jakarta data. 2.15
HIV prevalence (%) in adults (15–49) in Eastern Europe and Central Asia, 2007 2.16
HIV prevalence (%) in adults (15–49) in the Caribbean, 2007 2.17
HIV prevalence (%) in adults (15–49) in Latin America, 2007 2.18
HIV prevalence (%) in adults (15–49) in North America, Western and Central Europe, 2007 2.19
HIV infections newly diagnosed in injecting drug users and men who have sex with men, by country, and year of report, 2002–2006 3000 Men having sex with men Canada 2000 France Germany 1000 Italy Netherlands 0 Switzerland 2002 2003 2004 2005 2006 United Kingdom 600 Sources: (1) Public Health Agency of Canada. HIV and AIDS in Canada. Selected Surveillance Tables to June 30, 2007. Surveillance and Risk Assessment Division, Centre for Infectious Disease Prevention and Control, Public Health Agency of Canada, 2007. (2) Epidemiologisches Bulletin (5. Oktober 2007/Sonderausgabe B aktuelle daten und informationen zu infektionskrankheiten und public health). (3) The UK Collaborative Group for HIV and STI Surveillance Testing Times. HIV and other Sexually Transmitted Infections in the United Kingdom: 2007. London: Health Protection Agency, Centre for Infections. November 2007. (4) EuroHIV. HIV/AIDS Surveillance in Europe. End-year report 2006. Saint-Maurice: Institut de veille sanitaire, 2007. No. 75. (5) EuroHIV. HIV/AIDS Surveillance in Europe. Mid-year report 2007. Saint-Maurice: Institut de Veille Sanitaire, 2007. No. 76. Injecting drug users 400 200 0 2002 2003 2004 2005 2006 2.20
HIV prevalence (%) in adults (15–49) in Middle East and North Africa, 2007 2.21
Annual diagnoses of HIV infection and AIDS in Australia 1981–2006 HIV diagnoses AIDS diagnoses 2400 2000 1600 Number of diagnoses 1200 800 400 0 1981 1986 1991 1996 2001 2006 Year Source: National Centre in HIV Epidemiology and Clinical Research, 2007. Data available at http://www.nchecr.unsw.edu.au/NCHECRweb.nsf/resources/SurvRep07/$file/ASR2007.pdf 2.23
Selected events related to social determinants of the HIV epidemic Millennium Development Goals UN General Assembly “Declaration of Commitment on HIV/AIDS” recognises human rights as essential element in the global response Establishment of UN Secretary General’s Task Force on Women, Girls and AIDS 1st Global Parliamentary Meeting on AIDS calls for rights-based response to the epidemic and end to HIV-related travel restrictions Paris meeting establishing the Greater Involvement of People with AIDS (GIPA) principle Universal Access Targets Tools for measuring gender inequitable norms and HIV related stigma established Creation of the Global Coalition on Women and AIDS 3rd international consultation on HIV and Human Rights makes first call for universal access to prevention, treatment care and support Over 100 country and regional consultations identified stigma, discrimination and gender inequality as major barriers to universal access 2001 2008 2015 1994 2002 2003 2004 2005 2007 2010 Midway to Millennium Development Goals UN General Assembly Special Session on HIV/AIDS June 2001/ 189 Member States signed the Declaration of Commitment 3.1
Percentage of countries in regions reporting that women are addressed as a specific component of their multisectoral HIV strategy with a specific HIV budget for their activities 100 Women are addressed as a specific component of multisectoral HIV strategy Women are addressed as a specific component of multisectoral HIV strategy with a budget 80 60 Percentage of countries (%) 40 20 0 North America (1) Caribbean (12) South and South- East Asia (13) Sub- Saharan Africa (41) Oceania (7) Latin America (19) Middle East (4) Eastern Europe and Central Asia (16) East Asia (3) Western and Central Europe (14) (Number of countries reporting) Source: UNGASS Country Progress Reports 2008. 3.2
Percentage of countries (by region) reporting policies in place to ensure equal access to HIV prevention, treatment, care, and support for women and men 100 80 60 Percentage of countries (%) 40 20 0 Caribbean (12) Middle East (4) Oceania (7) Sub- Saharan Africa (41) Europe (30) South Asia (13) Latin America (19) East Asia (3) (Number of countries reporting) Source: UNGASS Country Progress Reports 2008. 3.3
Index of policies related to women’s vulnerability to HIV Sub-Saharan Africa East Asia South and South-East Asia Caribbean Middle East Oceania Latin America Eastern Europe and Central Asia 0 2 4 6 8 10 12 14 Scale of (0–14) Source: UNGASS Country Progress Reports 2008. 3.4
Percentage of countries (by region) reporting programmes designed to change societal attitudes of stigmatization associated with HIV and/or using indicators for reduction of HIV-related stigma and discrimination Countries reporting programmes designed to change societal attitudes of stigmatization associated with HIV and AIDS Countries reporting using performance indicators or benchmarks for reduction of HV-related stigma and discrimination 100 80 60 Percentage of countries (%) 40 20 0 Caribbean (12) East Asia (3) South and South- East Asia (13) North America (1) Sub- Saharan Africa (41) Latin America (19) Oceania (7) Western and Central Europe (13) Eastern Europe and Central Asia (16) Middle East (4) (Number of countries reporting) Source: UNGASS Country Progress Reports 2008. 3.5
Percentage of countries (by region) reporting legal protections against discrimination and relevant mechanisms Report laws or regulations protecting people living with HIV against discrimination Report mechanisms to report, document and address cases of discrimination against people living with HIV and/or most-at-risk populations 100 80 60 Percentage of countries (%) 40 20 0 East Asia (3) North America (1) Eastern Europe and Central Asia (16) Latin America (19) Oceania (7) Sub- Saharan Africa (41) South and South- East Asia (13) Caribbean (12) Middle East (4) Western and Central Europe (13) (Number of countries reporting) Source: UNGASS Country Progress Reports 2008. 3.6
Median percentage of population reached with HIV prevention services within the specified legal environment 100 Countries reporting having non-discrimination laws/regulations with protection for this population Countries reporting NOT having non-discrimination laws/regulations with protection for this population 80 Median percentage of population reached with HIV prevention services (UNGASS indicator 9) 60 40 20 0 Sex workers (N=42) Injecting drug users (N=17) Men having sex with men (N=28) Source: UNGASS Country Progress Reports 2008. 3.7
HIV Prevalence by wealth status: men 100 WEALTH QUINTILE 80 1 2 3 4 5 60 HIV prevalence (%) 40 20 0 Burkina Faso Ghana Cameroon Uganda Kenya UR Tanzania Malawi Lesotho Source: Mishra V, Bignami-Van Assche S, Greener R, Vaessen M, Hong R, Ghys P, Boerma T, Van Assche A,Khan S, Rutstein S, “HIV infection does not disproportionately affect the poorer in sub-Saharan Africa”, 2007,AIDS, Vol 21 Supplement 7, November 2007. 3.8
Selected events related to HIV prevention Millennium Development Goals Gay community responses organized in many developed countries UN General Assembly Declaration of Commitment: prevention is the mainstay of the AIDS response Treatment Action Campaign in South Africa supports mass marches for prevention Universal Access to Prevention endorsed by UN General Assembly Prevention of Mother to Child Transmission (PMTCT) found to be effective in resource-poor settings and recommended for implementation globally Universal Access Targets 34% of HIV-positive pregnant women are receiving antiretrovirals for PMTCT First Male circumcision trial, Orange Farm, South Africa Needle exchange programmes to reduce HIV transmission begin in Britain, Australia, Netherlands 40% of young males and 36% of young females have accurate knowledge about HIV prevention Global comprehensive prevention policy established Thailand introduces 100% condom use programme nationally 2001 2008 2015 1982–83 1986 1991 1998 2005 2006 2010 Midway to Millennium Development Goals UN General Assembly Special Session on HIV/AIDS June 2001/ 189 Member States signed the Declaration of Commitment 4.1
Namibia: HIV related knowledge and behaviour in the general population, 2000–2006 80 2000 2006 70 60 50 (%) 40 30 20 10 0 Female Male Female Male Female Male Female Male Female Male Tested for HIV in last 12 months (15–49 year olds) Comprehensive knowledge (15–24 year olds) Sex before age 15 (15–24 year olds) Sex with >1 partner in last 12 months (15–49 year olds) Condom use (15–49 year olds) Source: Namibia Country Progress Report 2008. 4.2
Comprehensive knowledge of HIV among young people (ages 15–24), 1999–2007 100 2010 Target 2005 Target 80 60 Male % Female 40 20 0 1999–2003 2004–2007 2010 Year Source: MEASURE DHS (2008) 4.3
Comprehensive knowledge of HIV among young people, by type of question 100 Males Females 80 60 (%) correct 40 20 0 Sharing food does not transmit HIV All 5 questions are correct Having only one faithful partner can protect against HIV Condoms can prevent HIV A healthy looking person can have HIV Mosquitos do not transmit HIV QUESTION Source: UNGASS Country Progress Reports 2008. 4.4
Percentage of countries with AIDS education as part of the school curriculum Secondary curriculum Teacher training Primary curriculum 100 80 60 Percentage of countries (%) 40 20 0 North America (1) Sub- Saharan Africa (41) Caribbean (12) Latin America (19) Oceania (7) Western and Central Europe (14) Eastern Europe and Central Asia (16) East Asia (3) South and South- East Asia (13) North Africa and Middle East (4) (Number of countries reporting) Source: UNGASS Country Progress Reports 2008. 4.5
Percentage of young people who have first sex before age 15, by sex Male Female 20 15 % 10 5 0 1998-2002 2003-2007 Year Source: Measure DHS. 4.6
Annual investment in preventive HIV vaccine research and development by source between 2000 and 2006 800 700 Multilaterals 600 US$ Millions Other Public Sector 500 Europe 400 US 300 200 100 0 2000 2001 2002 2003 2004 2005 2006 Year Source: HIV Vaccines and Microbicides Resource Tracking Working Group, 2007. 4.7
Country reporting on prevention services for populations most at risk, 2005 and 2007 Countries reporting on IDUs Countries reporting on sex workers Countries reporting on MSM Source: UNGASS Country Progress Reports 2008. 4.8