Download

1 / 25
290 likes | 579 Vues
6. Gene Regulatory Networks. EECS 600: Systems Biology & Bioinformatics Instructor: Mehmet Koyuturk. Regulation of Gene Expression. Transcriptional Regulation of telomerase protein component gene hTERT. Genetic Regulation & Cellular Signaling. Organization of Genetic Regulation.

E N D
6. Gene Regulatory Networks EECS 600: Systems Biology & Bioinformatics Instructor: MehmetKoyuturk
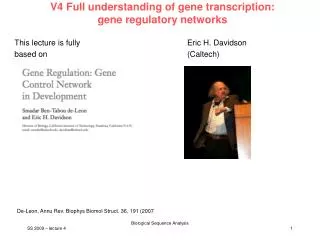
Regulation of Gene Expression Transcriptional Regulation of telomerase protein component gene hTERT EECS 600: Systems Biology & Bioinformatics
Genetic Regulation & Cellular Signaling EECS 600: Systems Biology & Bioinformatics
Organization of Genetic Regulation Negative ligand-independent repression at chromatin level Up-regulation Genetic network that controls flowering time in A. thaliana (Blazquez et al, EMBO Reports, 2001) Gene Down-regulation EECS 600: Systems Biology & Bioinformatics
Gene Regulatory Networks • Transcriptional Regulatory Networks • Nodes with outgoing edges are limited to transcription factors • Can be reconstructed by identifying regulatory motifs (through clustering of gene expression & sequence analysis) and finding transcription factors that bind to the corresponding promoters (through structural/sequence analysis) EECS 600: Systems Biology & Bioinformatics
Gene Regulatory Networks • Gene expression networks • General model of genetic regulation • Identify the regulatory effects of genes on each other, independent of the underlying regulatory mechanism • Can be inferred from correlations in gene expression data, time-series gene expression data, and/or gene knock-out experiments Observation Inference EECS 600: Systems Biology & Bioinformatics
Boolean Network Model • Binary model, a gene has only two states • ON (1): The gene is expressed • OFF (0): The gene is not expressed • Each gene’s next state is determined by a boolean function of the current states of a subset of other genes • A boolean network is specified by two sets • Set of nodes (genes) • State of a gene: • Collection of boolean functions EECS 600: Systems Biology & Bioinformatics
Logic Diagram • Cell cycle regulation • Retinoblastma (Rb) inhibits DNA synthesis • Cyclin Dependent Kinase 2 (cdk2) & cyclin E inactivate Rb to release cell into S phase • Up-regulated by CAK complex and down-regulated by p21/WAF1 • p53 EECS 600: Systems Biology & Bioinformatics
Wiring Diagram EECS 600: Systems Biology & Bioinformatics
Dynamics of Boolean Networks • Gene activity profile (GAP) • Collection of the states of individual genes in the genome (network) • The number of possible GAPs is 2n • The system ultimately transitions into attractor states • Steady state (point) attractors • Dynamic attractors: state cycle • Each transient state is associated with an attractor (basins of attraction) • In practice, only a small number of GAPs correspond to attractors • What is the biological meaning of an attractor? EECS 600: Systems Biology & Bioinformatics
State Space of Boolean Networks • Equate cellular with attractors • Attractor states are stable under small perturbations • Most perturbations cause the network to flow back to the attractor • Some genes are more important and changing their activation can cause the system to transition to a different attractor This slide is taken from the presentation by I. Shmulevich EECS 600: Systems Biology & Bioinformatics
Identification of Boolean Networks • We have the “truth table” available • Binarize time-series gene expression data • REVEAL • Use mutual information to derive logical rules that determine each variable • If the mutual information between a set of variables and the target variable is equal to the entropy of that variable, then that set of variables completely determines the target variable • For each variable, consider functions consisting of 1 variable, then 2, then 3, …, then i…, until one is found • Once the minimum set of variables that determine a variable is found, we can infer the function from the truth table • In general, the indegrees of genes in the network is small EECS 600: Systems Biology & Bioinformatics
REVEAL EECS 600: Systems Biology & Bioinformatics
Limitations of Boolean Networks • The effect of intermediate gene expression levels is ignored • It is assumed that the transitions between states are synchronous • A model incorporates only a partial description of a physical system • Noise • Effects of other factors • One may wish to model an open system • A particular external condition may alter the parameters of the system • Boolean networks are inherently deterministic EECS 600: Systems Biology & Bioinformatics
Probabilistic Models • Stochasticity can account for • Noise • Variability in the biological system • Aspects of the system that are not captured by the model • Random variables include • Observed attributes • Expression level of a particular gene in a particular sample • Hidden attributes • The boolean function assigned to a gene? EECS 600: Systems Biology & Bioinformatics
Probabilistic Boolean Networks • Each gene is associated with multiple boolean functions • Each function is associated with a probility • Can characterize the stochastic behavior of the system EECS 600: Systems Biology & Bioinformatics
Bayesian Networks • A Bayesian network is a representation of a joint probability distribution • A Bayesian network B=(G, ) is specified by two components • A directed acyclic graph G, in which directed edges represent the conditional dependence between expression levels of genes (represented by nodes of the graph) • A function that specifies the conditional distribution of the expression level of each gene, given the expression levels of its parents • Gene A is gene B’s parent if there is a directed edge from A to B • P(B | Pa(B)) = (B, Pa(B)) EECS 600: Systems Biology & Bioinformatics
Conditional Independence • In a Bayesian network, if no direct between two genes, then these genes are said to be conditionally independent • The probability of observing a cellular state (configuration of expression levels) can be decomposed into product form EECS 600: Systems Biology & Bioinformatics
Variables in Bayesian Network • Discrete variables • Again, genes’ expression levels are modeled as ON and OFF (or more discrete levels) • If a gene has k parents in the network, then the conditional distribution is characterized by rkparameters (r is the number of discrete levels) • Continuous variables • Real valued expression levels • We have to specify multivariate continuous distribution functions • Linear Gaussian distribution: • Hybrid networks EECS 600: Systems Biology & Bioinformatics
Equivalence Classes of Bayesian Nets • Observe that each network structure implies a set of independence assumptions • Given its parents, each variable is independent of its non-descendants • More than one graph can imply exactly the same set of independencies (e.g., X->Y and Y->X) • Such graphs are said to be equivalent • By looking at observations of a distribution, we cannot distinguish between equivalent graphs • An equivalence class can be uniquely represented by a partially directed graph (some edges are undirected) EECS 600: Systems Biology & Bioinformatics
Learning Bayesian Networks • Given a training set D = {x1, x2, …, xn} of m independent instances of the n random variables, find an equivalence class of networks B=(G, ) that best matches D • x’s are the gene expression profiles • Based on Bayes’ formula, the posterior probability of a network given the data can be evaluated as where C is a constant (independent of G) and is the marginal likelihood that averages the probability of data over all possible parameter assignments to G EECS 600: Systems Biology & Bioinformatics
Learning Algorithms • The Bayes score S(G : D) depends on the particular choice of priors P(G) and P( | G) • The priors can be chosen to be • structure equivalent, so that equivalent networks will have the same score • decomposable, so that the score can be represented as the superposition of contributions of each gene • The problem becomes finding the optimal structure (G) • We can estimate the gain associated with addition, removal, and reversal of an edge • Then, we can use greedy-like heuristics (e.g., hill climbing) EECS 600: Systems Biology & Bioinformatics
Causal Patterns • Bayesian networks model dependencies between multiple measurements • How about the mechanism that generated these measurements? • Causal network model: Flow of causality • Model not only the distribution of observations, but also the effect of observations • If gene X codes for a transcription factor of gene Y, manupilating X will affect Y, but not vice versa • But in Bayesian networks, X->Y and Y->X are equivalent • Intervention experiments (as compared to passive observation): Knock X out, then measure Y EECS 600: Systems Biology & Bioinformatics
Dynamic Bayesian Networks • Dependencies do not uncover temporal relationships • Gene expression varies over time • Dynamic Bayesian Networks model the dependency between a gene’s expression level at time t and expression levels of parent genes at time t-1 EECS 600: Systems Biology & Bioinformatics
Linear Additive Regulation Model • The expression level of a gene at a certain time point can be calculated by the weighted sum of the expression levels of all genes in the network at a previous time point • ei : expression level of gene i • wij : effect of gene j on gene i • uk: kth external variable • nik: effect of kth external variable on gene j • bi : gene-specific bias • Can be fitted using linear regression EECS 600: Systems Biology & Bioinformatics